

The major goal of this project is to develop a computationally efficient multiscale model of blood flow and platelet mediated thrombosis using cutting-edge molecular dynamics and dissipative particle dynamics numerical approaches to understand blood flow mediated thrombosis in cardiovascular diseases and devices. The project deploys a high-performance computing (HPC) resources around the globe that enhances the research, education and training activities of researchers. For more details, visit the Biofluids Research Group’s Multiscale Modeling page.
| Data for building the model | Published? | Private? | How is credibility checked? | Current Conformance Level / Target Conformance Level |
|---|---|---|---|---|
| in vitro (primary cells cell, lines, etc.) | yes | Specific individual data are private, Averaged data is available | Use our machine learning pipelines | Extensive |
| ex vivo (excised tissues) | ||||
| in vivo pre-clinical (lower-level organism or small animal) | ||||
| in vivo pre-clinical (large animal) | ||||
| Human subjects/clinical | ||||
| Other: ________________________ |
| Data for validating the model | Published? | Private? | How is credibility checked? | Current Conformance Level / Target Conformance Level |
|---|---|---|---|---|
| in vitro (primary cells cell, lines, etc.) | yes | Specific individual data are private, Averaged data is available | Use our machine learning pipelines | Extensive |
| ex vivo (excised tissues) | ||||
| in vivo pre-clinical (lower-level organism or small animal) | ||||
| in vivo pre-clinical (large animal) | ||||
| Human subjects/clinical | ||||
| Other: ________________________ |
| Who does it? | When does it happen? | How is it done? | Current Conformance Level / Target Conformance Level | |
|---|---|---|---|---|
| Verification | Our machine learning pipelines | throughout model development | Numerical simulations are performed under physiological and pathological shear stresses relevant to blood vessels | Extensive |
| Validation | Our multiscale simulator package | throughout development | model is used to reproduce experimental scenarios | Extensive |
| Uncertainty quantification | Our simulator package | throughout model development | study the impact of parameters on model performance | Extensive |
| Sensitivity analysis | User perform sensitivity study | each time the model is used to simulate a new scenario | post processing | Adequate |
| Other:__________ | ||||
| Additional Comments |
| Disclaimer statement (explain key limitations) | Who needs to know about this disclaimer? | How is this disclaimer shared with that audience? | Current Conformance Level / Target Conformance Level |
|---|---|---|---|
| Numerical simulations are accurate in the context of published data and in-house in vitro observations. We do not make conclusions beyond the experimentally validated conditions. | Users | discussed limitations in our papers. | Extensive |
| Further limitations are due to capacity of the software to model biological observations and limitations of the HPC resources used. | Programmers | discussed limitations in our papers. | Extensive |
| Current Conformance Level / Target Conformance Level |
|---|
| Adequate |
| Naming Conventions? | Repository? | Code Review? | |
|---|---|---|---|
| individual modeler | yes | yes | yes |
| within the lab | yes | yes | yes |
| collaborators | n/a |
| Current Conformance Level / Target Conformance Level | |
|---|---|
| Code commented? | Adequate |
| Scope and intended use described? | Extensive |
| User’s guide? | Adequate |
| Developer’s guide? | Partial |
| Current Conformance Level / Target Conformance Level |
|---|
| Extensive |
| Target Audience(s): | “Inner circle” | Scientific community | Public |
|---|---|---|---|
| Simulations | yes | yes | |
| Models | yes | yes | |
| Software | yes | yes | |
| Results | yes | yes | |
| Implications of results | yes | yes |
| Current Conformance Level / Target Conformance Level |
|---|
| Adequate |
| Reviewer(s) name & affiliation: | |
|---|---|
| When was review performed? | |
| How was review performed and outcomes of the review? |
| Current Conformance Level / Target Conformance Level |
|---|
| Extensive |
| Yes or No (briefly summarize) | |
|---|---|
| Were competing implementations tested? | yes, Within our group, we test the efficiency of various iterations of our DPD and CGMD codes to select the most appropriate model parameters (i.e. Morse potential, bond force parameters, etc.). |
| Did this lead to model refinement or improvement? | yes |
| Current Conformance Level / Target Conformance Level |
|---|
| Adequate |
| Yes or No (briefly summarize) | |
|---|---|
| Are there operating procedures, guidelines, or standards for this type of multiscale modeling? | yes |
| How do your modeling efforts conform? | yes, we follow commonly followed practices for blood/platelet preparation, microscopy, and statistical analysis as published in relevant experimental journals. |
1. Summary: The major goal of this project is to develop a computationally efficient multiscale model of blood flow and platelet mediated thrombosis using cutting-edge molecular dynamics and dissipative particle dynamics numerical approaches to understand blood flow mediated thrombosis in cardiovascular diseases and devices. The project deploys a high-performance computing (HPC) resources around the globe that enhances the research, education and training activities of researchers. For more details, visit the Biofluids Research Group’s Multiscale Modeling page.
2. Model Credibility Assessment: All multiscale simulations are validated using data collected from experiments performed in the PI’s/Co-PI’s (DB, MJS) laboratories and experimental data from literature. Model parameters are compared with experimental results for validation and iterative adjustment until differences between the model predictions and the experimental data is minimized. Major phenomena that are modeled include (1) geometrical, rheological, and material properties using in vitro results, (2) shear mediated platelet shape change using the Hemodynamic Shearing Device (HSD) and scanning electron microscopy (SEM); and (3) flow-mediated platelet flipping, aggregation, and adhesion in microchannels with high framerate DIC microscopy. The table below lists key experimental and model parameters, and how the latter are adjusted based on validation experiments. Following this list is an example of how platelet aggregation events in microchannels, as measured using high framerate DIC microscopy, are used to validate our aggregation model.
Planned Actions in Model Credibility Plan and Description of Information Gained
Validation of Model Parameters
|
Key Experiments Parameters |
Key Model Parameters |
Adjustable Model Parameters |
|
Material property: μ of plasma: 1.1~1.3 mPa•s at 37°C. Diameter of platelet: 2-5 μm. Aspect ratio: ¼ |
γ and rcut in DPD correspond to resultant μ of plasma. Current μ of plasma: 1.12 mPa•s. Diameter: 4 μm. Aspect ratio: ¼ |
Increase γ to increase μ of plasma and rcut needs to change accordingly. μ: viscosity. |
|
Shape change: (HSD and microchannel + microscopy/SEM) flow |
Couette flow shear stress: up to 400 dyne/cm2. tsmax controls growth duration, α controls filopodia growth rate in response to shear stress-exposure time combinations |
Couette flow BCs adjusted for |
|
Flipping experiments in microchannels - real time DIC microscopy (Jeffery’s orbit |
γ in DPD and ε, σ in LJ potential controls the fluid-platelet interaction230. σ – key parameter controlling flipping platelets and their trajectory |
Parameters are adjusted according to results from Jeffery’s orbit. σ mainly controls the trajectory of flipping platelets. Other sub parameters change correspondingly. |
|
Platelet stiffness with DEP: E = 1.93~6.88 KPa; ΔL/L: 0~0.2; Poisson’s ratio: 0.25~0.35. |
Bi-layered membrane: kb=0.023 N/m, r0 = 33 nm. Model values: E: from 1.14 KPa to total rigidity; ΔL/L: 0~0.5; Poisson’s ratio: 0.37. |
kb adjusted by matching E of experiments. E: Young’s modulus, L: axial diameter- deformability of platelet change correspondingly. |
|
Micropipette aspiration: |
Stiffness of membrane controlled by spring force constant kb. Model value |
kb adjusted to match the modulated elasticity of membrane in experiments. |
|
µ of cytoplasm: 4.1~23.9 mPa·s. |
Morse potential: control parameters include ε, α and R. |
ε mainly controls µ. α takes empirical value (α=7). R- particles average distance. |
|
Modulating membrane fluidity with antiplatelet agents (e.g., DMSO)-DEP+fluorescence measurements: E, |
kb of membrane changed (range 10-2 ~ |
Increase kb to reflect membrane stiffness. Other parameters adjust accordingly. Platelets deformability adjusted, γ -adhesion properties are adjusted to corroborate experimental values for membrane. |
|
Aggregation: the bond length for GPIIb/IIIa-Fg-GPIIb/IIIa. Interaction distance for integrated platelets when a bond can begin to form. Contact are between aggregation platelets: 1.950±0.484 μm2. Detaching force is estimated based on the rupture force from atomic force microscopy (AFM) results: 9~18 nN. |
GPIIb/IIIa-Fg-GPIIb/IIIa bond length 67.5 nm is modeled in the Morse potential as equilibrium bond distance. Cutoff of aggregation is approximated as 87.5 nm when a bond can begin to form. α = 1 and D0 = 1.45×10⁻¹⁹ J in the Morse potential corresponds to the contact area: 2.227±0.003 μm2. fA=0.82 pN in the Hooke’s term corresponds to the detaching force: 17.842 ± 0.027 nN. |
These is an optimal value for α to maximize the contact area: as α increases, contact area first increases then decreases Increase D0 also increases the contact areas. Increase fA increases the strength of detaching forces between aggregated platelets but may ruin the integrity of the platelet so it is adjusted to the in vitro results range, while platelet shape is intact. |
|
Adhesion: microscopy of observed adhesion patterns (vasc. wall-cultured HUVEC + vWF + Fg +fibronectin. Device surface + Fg). |
GPIIb/IIIa-vWF binding potential, GPIbα-vWF-GPIbα, f A- adhesion force magnitude coefficient (time dependent), rij- inter-receptor distance, na- # of receptors, dc- relaxation distance, vWF multimer, GPIIb/IIIa-Fg binding potential. |
Up to 50,000 GPIIb/IIIa and 25,000 GPIB receptors, na controls receptor # - model patterns (plt-plt. and/or surface binding and number- rij adjusted to expt. rij < dc; rij –distance between 2 receptors when 2 plts come in contact.). |


Multiscale Modeling of Platelet Aggregation Under Shear Flow
Fig. 1 shows the recruitment of marginated platelets and the initiation of platelet-platelet aggregation. We constructed a molecular-level hybrid force field that combines Morse and Hooke potentials to mimic the binding of GPIIb-IIIa and fibrinogen during initial recruitment and aggregation. The nonbonded pairwise interaction of the receptors was derived from the Morse potential and the bonded interactions were described as harmonic functions. The hybrid force field was parametrized for reproducing morphologic characteristics as contact area during aggregation. The predictive in silico results are validated by a machine learning-based model that is pre-trained from in vitro data. We compared rigid and deformable platelets and observed that a rigid model significantly underestimated the contact area of aggregated platelets, as validated in vitro. Platelet-platelet contact area measured in vitro increased from 1.59±0.48 to 2.00±0.55 μm2, while platelet surface area increased slightly (21.56±0.62 to 21.89±0.7 µm2), as shear stress increased from 1 to 10 dyne/cm2 (n=20-23, Fig. 2B). Numerically simulated contact areas correlated well with in vitro measurements in this shear stress range.
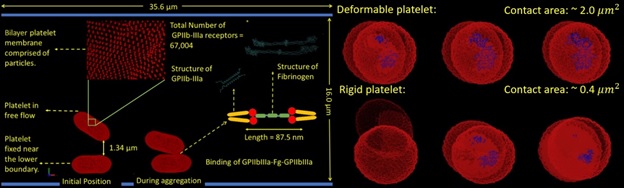
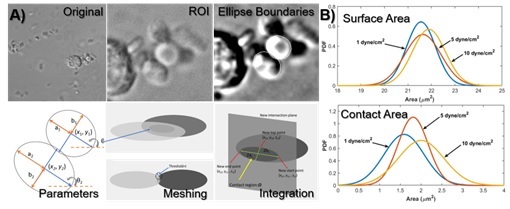
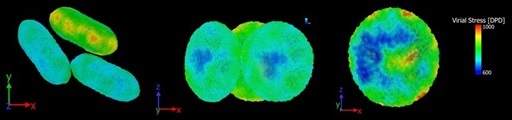
Fig. 3 shows the aggregation process of three-platelet aggregation. We used the same GPIIb-IIIa and fibrinogen binding model as described above. While simulating the aggregation process in free flows, we measured the mapped dynamic stresses on the surfaces of individual platelets. The in-silico data show (1) high stress spots around the periphery of the platelets as the simulation proceeds, and that these areas of high stress may lead to formation of pseudopods during platelet activation.; and (2) stress increases in the platelet contact regions.
Uncertainty Quantification (UQ) and Parameter Sensitivity Analysis
UQ and sensitivity analysis identifies time-stepping sizes and spatial resolutions for desired accuracy, and is performed via iterative numerical parameter optimization and global parameter sensitivity until convergence. This approach is used for both our experiments (machine learning to predict interplatelet contact area under a large range of shear stresses) and numerical models (machine learning to reduce computational time while maintaining accuracy). Examples of these approaches for our aggregation model and experiments are detailed below.
Machine Learning Method in Modeling Experimental Data
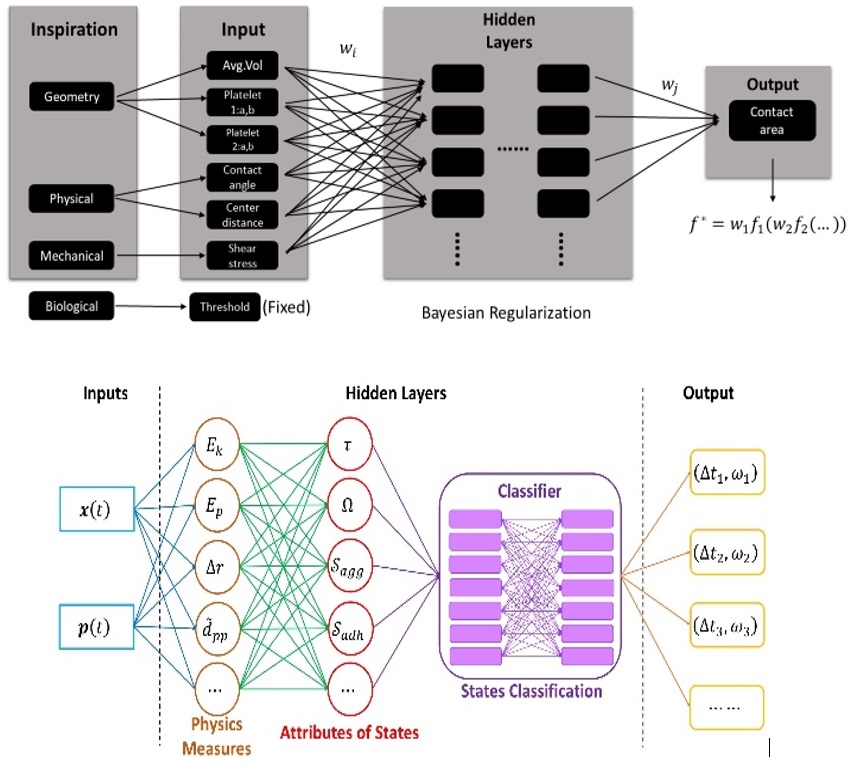
Images, recorded at 200 fps on a DIC microscope (Nikon Ti-Eclipse), were analyzed to obtain platelet geometric parameters, meshed and integrated to determine contact area, and input into a neural network machine learning-based model to predict inter-platelet contact area (Fig. 4A). In this model, we chose the geometry measures such as platelet major and minor diameters, aspect ratio, circularity, volume and surface area, and inter-platelet distance and contact angle, as well as flow stresses. We estimate the contact area. In the training set, we select a range of shear stresses: 1, 5 and 10 dyne/cm2. To test the estimation function, we chose another shear stress of 6.7 dyne/cm2. The model we use in the machine learning process is a feed-forward neural network with 2 hidden-layers, and each layer has 10 nodes. We randomly choose 75% of the data to train the model and the rest 25% as testing samples for trained models. As calculating weights, we use Bayesian regularization algorithm to minimizing the cost function.
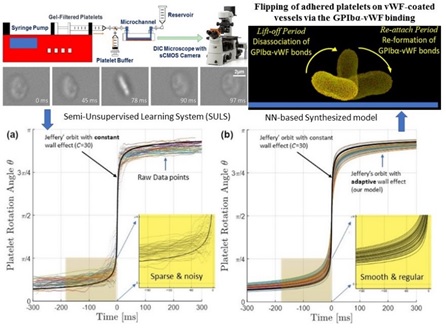
Similarly, streaming images from the in vitro experiments for platelet adhesion on vWF-coated microchannels, captured at 1000 fps, are processed by a semi-unsupervised learning system (SULS) and used as inputs for another neural network to handle the sparse and noisy in vitro data for a synthesized model that predicts the flipping and re-attaching periods of an adhered platelet on the blood vessels. The prediction from the NN-based model clearly differentiated the change of flipping speeds in the two periods, and can be further used in the parameter estimation of our multiscale modeling process.
Machine Learning Method for More Efficient Modeling without Losing Significant Accuracy
Our previous multiple time-stepping (MTS) scheme was improved by using deep learning-based state-driven adaptive time stepping (ATS) to intelligently adapt to platelet dynamics and shear conditions (Fig. 4B). Our model can classify states then label state categories with optimal time step sizes. Compared to a traditional algorithm, our algorithm could reduce one day of simulation to approximately 1~2 hours, while maintaining no less than 95% accuracy.
Sharing of Model Algorithms and Experimental Results
Our model software files, numerical results, and experimental data will initially be made available to 3rd party IMAG scientists and other interested researchers via the Biofluids Research Group website. We are also currently exploring using the Google Cloud Platform (GCP) to store larger amounts of data and allow easier access to our software packages and results.
Actions/Activities (CPMS TSR)
|
Rule 1. Define context clearly |
Our DPD-CGMD models are designed to reflect platelet properties and dynamics under shear stresses found in blood flow through diseased vessels and cardiovascular devices. |
|
Rule 2. Use appropriate data |
We ensure that all parameters and input variables are based on published and in-house in vitro observations. If any parameters cannot be validated (due to lack of available data or techniques), other model variables are monitored to ensure accurate reflection of platelet biology |
|
Rule 3. Evaluate within context |
Numerical simulations are performed under physiological and pathological shear stresses relevant to blood vessels (normal/diseased) and blood-recirculating cardiovascular devices, with appropriate blood properties (i.e. viscosity, temperature). |
|
Rule 4. List limitations explicitly |
Numerical simulations are accurate in the context of published data and in-house in vitro observations. We do not make conclusions beyond the experimentally validated conditions. Further limitations are due to capacity of the software to model biological observations and limitations of the HPC resources used. |
|
Rule 5. Use version control |
All experimental data are traced by their creation date and record the experimenters’ names. All DPD-CGMD files track the creation date. |
|
Rule 6. Document adequately |
Simulation codes/model markups and changes within are tracked and shared among the simulation group. All experimental data are stored in a database (currently in video and spreadsheet format) and shared among all team members, allowing interfacing with numerical software. Protocols are shared and updated via Stony Brook’s Google Drive services |
|
Rule 7. Disseminate broadly |
Simulation software and data/experimental database is currently shared via Google Drive, and we are exploring sharing broadly via the Google Cloud Platform. These items are also presented during regular meetings and national/international conferences. |
|
Rule 8. Get independent reviews |
Our algorithms and experimental data will be shared with fellow IMAG researchers with similar work (i.e. Drs. Alber and Karniadakis) for independent evaluation. |
|
Rule 9. Test competing implementations |
Within our group, we test the efficiency of various iterations of our DPD and CGMD codes to select the most appropriate model parameters (i.e. Morse potential, bond force parameters, etc.). Due to the uniqueness of our approach, we do not have an external algorithm for direct comparison. |
|
Rule 10. Conform to standards |
While there are no set standards for our platelet-based experiments, we follow commonly followed practices for blood/platelet preparation, microscopy, and statistical analysis as published in relevant experimental journals. |
Uniqueness of Model Credibility Plan and Development of a Credible Model
(1) Utilizing in-house equipment (HSD, DIC microscopy, and microchannel setup) to validate: (1.a) shear-mediated platelet shape change, kinematics, and (1.b) aggregation/adhesion simulations due to lack of published data. (2) Identifying and quantifying the dominant sources of uncertainties: (2.a) reductionist model assumptions in expressing the true physiology; (2.b) computing uncertainties due to mathematical function truncations and runoff resulting from finite data representations; and (2.c) input parameter uncertainties due to limitations of experimental apparatus. (3) Minimizing the global uncertainties by (3.a) ensuing the accuracy for local scales and the associated model parameters; (3.b) smoothening the interface between scales; (3.c) stress testing to reduce global uncertainties by adjusting algorithmic and model parameters in broad ranges; and (3.d) collaborating with 3rd party IMAG scientists for independent verification of the numerical models and experimental results.
Our project relies on a synergistic relationship between the numerical models and validation experiments. Members of the numerical and experimental teams meet frequently and participate in observation of the other team’s activities as well as troubleshooting from the other’s perspective as needed. We have graduate students who are involved in both numerical and experimental activities to ensure that all members are on the same page regarding project goals and daily activities. As such, the models developed by our group are rooted in in-house biological observations, supplemented by widely accepted platelet activation, aggregation, and adhesion studies published by prominent experts in the field.
Progress to-date/Plans for Next Reporting Cycle
We have completed our initial models of intraplatelet properties, mechanics, shape change, dynamics in viscous fluids, and shear-induced aggregation with fibrinogen (as described above). We are currently modeling aggregation with multiple (3+) platelets using vWF and building a model of platelet adhesion on vWF under a large range of shear stresses (1-90 dyne/cm2). Current experiments track translational and rotational motion (i.e. “sliding” and “flipping”) of platelets under these stresses, their shape change, as well as comparisons of these parameters between activated and quiescent platelets. In the next 6 months, we are going to model the multi-platelet aggregation under shear flow and the platelet adhesion to blood vessel, and simulate the platelet-platelet-vessel dynamic interactions under shear flow.
Critical Issues/Concerns/Opportunities
There are several continuing challenges that we have identified in our modeling approaches. However, these issues provide us with opportunities to make new experimental observations regarding platelet behavior under flow conditions and develop new computational approaches to DPD-MD models and high-performance computing. The limited number of techniques to observe platelet deformation, activation, aggregation, and adhesion under flow conditions have allowed us to generate unique protocols for microscopy observations in microchannels. Due to the large number of unknown modeling and simulation parameters, we use machine learning approaches for developing predictive models based on training data from experiments. Due to the vast spatial and temporal scales involved in our simulations, we have adapted discrete particle-based methods (DPD-CGMD) to describe continuum multiscale phenomena. Our approach requires large amounts of computational resources. To reduce computational time while maintaining accuracy, we continue to improve the efficiency of our algorithms on high performance computers (HPCs) by developing Multiple Time Stepping (MTS) and Adaptive Time Stepping (ATS) approaches to optimize time scales of our simulations. Due to the uniqueness of our MSM approach, we require our 3rd party evaluators to have knowledge of LAMMPS molecular dynamics software; familiarity with MD, CGMD, and DPD theory; familiarity with the basics of platelet activation, aggregation, and adhesion; and have access to HPC resources for large multiscale simulations.
All multiscale simulations are validated using data collected from experiments performed in the PI’s/Co-PI’s (DB, MJS) laboratories and experimental data from literature. Model parameters are compared with experimental results for validation and iterative adjustment until differences between the model predictions and the experimental data is minimized. Major phenomena that are modeled include (1) geometrical, rheological, and material properties using in vitro results, (2) shear mediated platelet shape change using the Hemodynamic Shearing Device (HSD) and scanning electron microscopy (SEM); and (3) flow-mediated platelet flipping, aggregation, and adhesion in microchannels with high framerate DIC microscopy. The table below lists key experimental and model parameters, and how the latter are adjusted based on validation experiments. Following this list is an example of how platelet aggregation events in microchannels, as measured using high framerate DIC microscopy, are used to validate our aggregation model.