
Demonstrate peak detection using model of Cardiac Action Potential with Ca, K, and Na currents. Model from Beeler-Reuter 1977 paper.
Description
This model shows a simple peak detection algorithm in use to find current peaks in the
Beeler-Reuter 1977 model, the first action potential model accounting for calcium currents.
The peak detection algorithm is a Java procedure and is called from the JSim MML model.
A peak is detected if, after a maximum value, the slope is negative for successive sampling pts,
the number of points determined by the user (parameter 'pkCheck' in model). The number of peaks
to detect must be specified before the simulation is run (parameter 'numberOfPeaks') and so
it is best to pick a number larger than the anticipated number of peaks. The Java procedure is
at the beginning of the model and is called 'getAllMaxVals(pkCheck,u@t;v@pts,time@pts)'. The
parameters it takes are as follows:
- pkCheck: number of points passed pk candidate to check and see if it is a peak or just a noise spike.
- u@t: Time course variable we are locating peaks in (domain 't')
- v@pts: This will hold all found peak values limited by pts.ct (ie. number of peaks stored limited by pts.ct)
- time@pts: This will hold all found peak times.
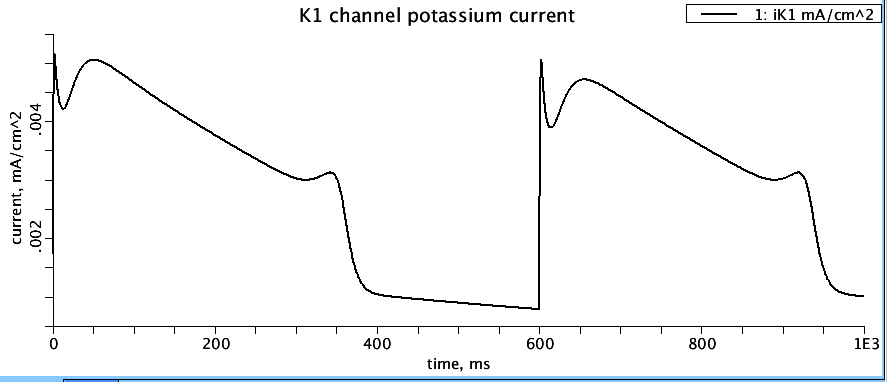
This example attempts to detect peaks in the potassium channel current (iK1). See model code section
'Peak detection call' for the details of JSim MML model call to the Java procedure. The actual call is:
getAllMaxVals(pkCheck,iK1@t,iK1MVals@mpts,iK1MTimes@mpts);
pkCheck and iK1@t are inputs and iK1MVals@mpts, iK1MTimes@mpts are the outputs. 'iK1@t' tells JSim to
pass in the values of iK1 for all t (iK1 is a function of domain t). Run the simulation
(parameter set 'pk_detect'). Note that 'pkCheck' is 10, meaning the slope after a peak has been detected needs
to be negative for 10 consective samples of domain t. In plot page 'current', look at the bottom panel
showing K1 channel current and note the six main peaks (2 sets of three) over the course of 1000 ms.
Also zoom in around 1 ms and 600 ms and you will see two small peaks on the front of the sharp, high
current peak. Now look at plot page 'Peak_detect'. Hit the 'Text' tab at bottom to see the dat in table form:
mpts iK1MTimes iK1MVals
ms mA/cm^2
0 2.1 .00515264 <--- Peak detected at 2.1 ms with value of 0.00515 mA/cm^2
1 50.7 .00505404
2 342.2 .00312469
3 602.2 .00507154
4 655.2 .0047175
5 919.2 .00312468
6 0 0
7 0 0
8 0 0
9 0 0
Six peaks were detected. To also detect the two small peaks at 1 and 600 ms change the value of 'pkCheck' from 10 to 2
and run the simulation. The 'Peak_detect' plot page table should be similar to this:
mpts iK1MTimes iK1MVals
ms mA/cm^2
0 .5 .00309484 <--- additional peak found at 0.5 ms
1 2.1 .00515264
2 50.7 .00505404
3 342.2 .00312469
4 600.6 .00310433 <--- additional peak found at 600.6 ms
5 602.2 .00507154
6 655.2 .0047175
7 919.2 .00312468
8 0 0
9 0 0
By varying the threshold for peak detection you will hopefully be able to exclude sharp spike due to noise.
Note: this algorithm does not set a threshold for excluding wide (slowly changing) peaks which could be due to
slowly changing background noise.
https://www.imagwiki.nibib.nih.gov/physiome/jsim/models/webmodel/NSR/BeelerReuter77 for more
details of the Beeler-Reuter 1977 model.)
A brief description of the Beeler-Reuter model:
The Na current, iNa, is a variant of the Hodgkin Huxley Na current, modified by
having a second inactivation variable j, The potassium current iK1 is inward rectifier.
The ix1 current represents a summation of other K currents in the dog
heart, and is somewhat empirical. The code is overly compact, to keep it on one page.
Notation is provided after the program code. The Na and K concentrations are fixed,
but Cai is variable: Ca influx with each excitation is counterbalanced by a slow
"efflux" represented by an exponential return (time constant tauCa) toward the
initial Cai.
Equations
The equations for this model may be viewed by running the JSim model applet and clicking on the Source tab at the bottom left of JSim's Run Time graphical user interface. The equations are written in JSim's Mathematical Modeling Language (MML). See the Introduction to MML and the MML Reference Manual. Additional documentation for MML can be found by using the search option at the Physiome home page.
- Download JSim model MML code (text):
- Download translated SBML version of model (if available):
- No SBML translation currently available.
- Information on SBML conversion in JSim
We welcome comments and feedback for this model. Please use the button below to send comments:
 Beeler GW Jr and Reuter H. Reconstruction of the action potential of ventricular
 myocardial fibres. J Physiol (Lond) 268: 177-210, 1977.
Please cite https://www.imagwiki.nibib.nih.gov/physiome in any publication for which this software is used and send one reprint to the address given below:
The National Simulation Resource, Director J. B. Bassingthwaighte, Department of Bioengineering, University of Washington, Seattle WA 98195-5061.
Model development and archiving support at https://www.imagwiki.nibib.nih.gov/physiome provided by the following grants: NIH U01HL122199 Analyzing the Cardiac Power Grid, 09/15/2015 - 05/31/2020, NIH/NIBIB BE08407 Software Integration, JSim and SBW 6/1/09-5/31/13; NIH/NHLBI T15 HL88516-01 Modeling for Heart, Lung and Blood: From Cell to Organ, 4/1/07-3/31/11; NSF BES-0506477 Adaptive Multi-Scale Model Simulation, 8/15/05-7/31/08; NIH/NHLBI R01 HL073598 Core 3: 3D Imaging and Computer Modeling of the Respiratory Tract, 9/1/04-8/31/09; as well as prior support from NIH/NCRR P41 RR01243 Simulation Resource in Circulatory Mass Transport and Exchange, 12/1/1980-11/30/01 and NIH/NIBIB R01 EB001973 JSim: A Simulation Analysis Platform, 3/1/02-2/28/07.