
Models two compartments with a single substance passively exchanging between the two compartments, plus first order binding to solute Z to form ZC, both of which are confined to V1.
Description
 This is a model of two compartments, one with volume V1
 and initial concentration C10, and the other with volume
 V2 and concentration C20. The two compartments exchange
 material at a rate PS. PS is the product of the permeability
 multiplying the surface area. The exchange is passive and
 equal in both directions in this model.
   In this newer version, built upon model #245 in the JSim library
 at www.imagwiki.nibib.nih.gov/physiome, is a first order binding site Z in V1. It still
 contains the analyticC1 and ..C2 from the parent model the time
 course in the absence of a binding site, and which track the solutions
 for C1 and C2 whenthere is no binding substance, Ztot= 0.

   Par Set KdDown:  With Kd for binding = 10 mM and Ztot =10 mM,
 and initial values of C1 and C2 at 20 and 2 mM, there is a rapid
 early rise in the bound form ZC (blue) in the first 0.3 s, after which it
 drops toward its final steady state level. C1 and C2 take smooth routes
 to the final equilibrium level, necessarily below the level reached in
 the absence of the binding site (black  and red lines).
 Running the loops, lowering the Kd for the site from 100 to 10^-3 mM:
 at Kd = 100 mM, the affinity is low, and the model solutions for C1 and C2
 are just a little lower than for the result with Ztot=0, But with higher
 affinities, Kds down to 1e-3, the final concentrations are lowered to about
 half as high, but no further. No further because ZC almost = Ztot,
 i.e. all the binding sites are filled. To lower the concentrations more
 requires increasing Ztot. Why just from 10 mM to 6.5 mM? Because with the
 inital conditions of Kd =10 mM and C1 = 20 mM and C2 = 2 mM,i.e. there was
 not enough binder, Z, to soak up even half of C1 when more C entered V1
 from V2 via the PS = 0.1 ml/sec.

   ParSet ZtotUp: Using parameter values as for Par Set KdDown,
 the effect of increasing the binding capacity is readily predicable;
 The early peak in ZC around 0.3 sec remains evident at all levels, a
 consequence of the combination of PS, the V's and the kon. The dot-dot
 curves are for the highest Ztot, = 40 mM (blue) and the lowest equilibrium
 concentration of unbound C1 (black dot-dot at about 3.7 mM), and the lowest
 C2 (red dot-dot) equilibrating with C1 at 3.7 mM. Summary, higher Ztot has
 little effect on the time to equilibrate, but lowers the free equilibirum
 concentrations unidirectionally with the increase.
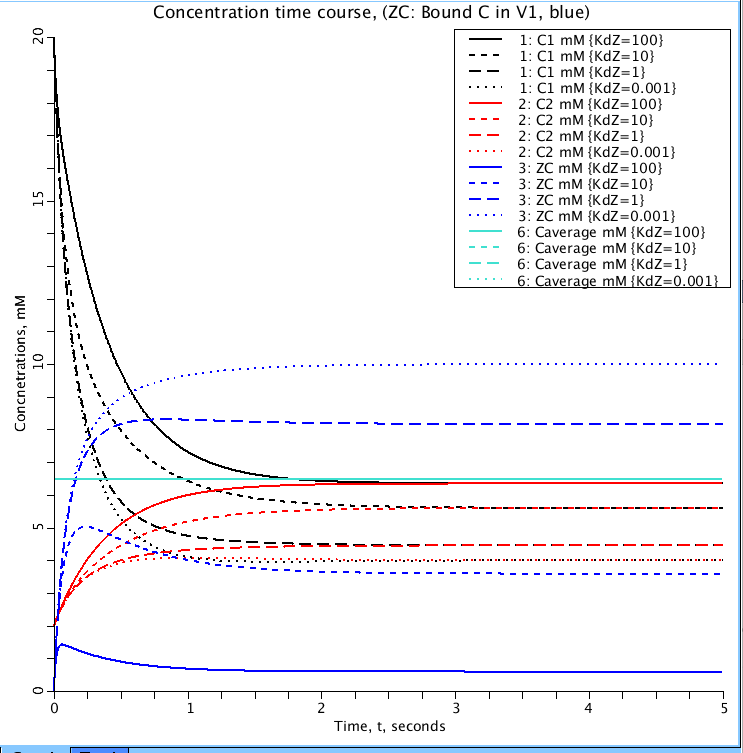
Figure 1: Parameter set 'KdDown'. Shows the effect of Kd (dissociation constant) on the binding of C1(black) to Z (ZC blue) in volume V1. Values for Kd are 100, 10, 1, 0.001 mM. C2(red), mM, is the concentration of C in volume V2. Caverage (light blue), mM, is total amount of C in both compartments. It is a check to confirm no loss or gain of mass.
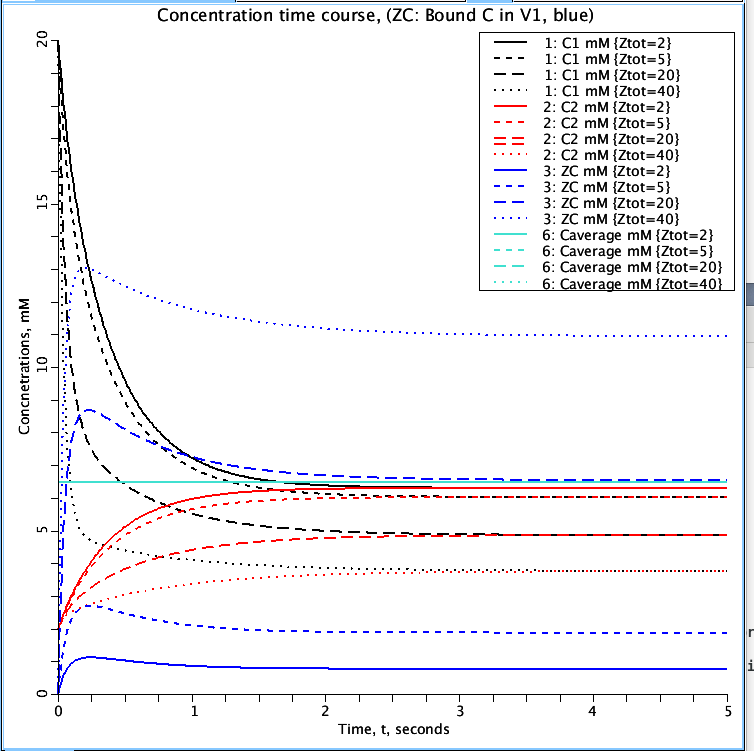
Figure 2: Parameter set 'ZtotUp'. The effect the total amount of Z (Ztot) has on the amount of C bound to Z (ZC blue) in volume V1. Simulations run for Ztot values of 2, 5, 20, and 40 mM. Curves represent the same variables as in Figure 1.
Equations
The equations for this model may be viewed by running the JSim model applet and clicking on the Source tab at the bottom left of JSim's Run Time graphical user interface. The equations are written in JSim's Mathematical Modeling Language (MML). See the Introduction to MML and the MML Reference Manual. Additional documentation for MML can be found by using the search option at the Physiome home page.
- Download JSim model MML code (text):
- Download translated SBML version of model (if available):
We welcome comments and feedback for this model. Please use the button below to send comments:
None.
Please cite https://www.imagwiki.nibib.nih.gov/physiome in any publication for which this software is used and send one reprint to the address given below:
The National Simulation Resource, Director J. B. Bassingthwaighte, Department of Bioengineering, University of Washington, Seattle WA 98195-5061.
Model development and archiving support at https://www.imagwiki.nibib.nih.gov/physiome provided by the following grants: NIH U01HL122199 Analyzing the Cardiac Power Grid, 09/15/2015 - 05/31/2020, NIH/NIBIB BE08407 Software Integration, JSim and SBW 6/1/09-5/31/13; NIH/NHLBI T15 HL88516-01 Modeling for Heart, Lung and Blood: From Cell to Organ, 4/1/07-3/31/11; NSF BES-0506477 Adaptive Multi-Scale Model Simulation, 8/15/05-7/31/08; NIH/NHLBI R01 HL073598 Core 3: 3D Imaging and Computer Modeling of the Respiratory Tract, 9/1/04-8/31/09; as well as prior support from NIH/NCRR P41 RR01243 Simulation Resource in Circulatory Mass Transport and Exchange, 12/1/1980-11/30/01 and NIH/NIBIB R01 EB001973 JSim: A Simulation Analysis Platform, 3/1/02-2/28/07.