
Java function call. Given y(n) and x(n) (both monotonic). They can be regarded as y(x) and x(y), and given YY, find XX such that y(XX)=YY using binary search.
Description
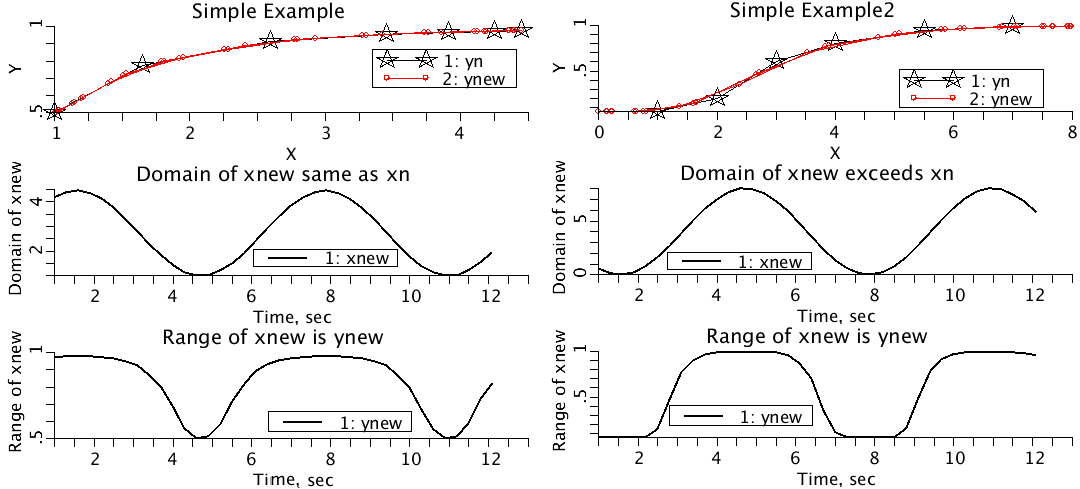
A simple example illustrates the use of fgen: Run the
model named simpleExample and display plotpage Simple.

The simpleExample model does the following:
Generates

   yn = =xn^alpha/(1+xn^alpha)

where xn is monotonic but unevenly spaced. Generates xnew, where
xnew is random. Generates ynew by linearly interpolating (xn,yn)
using xnew.
- - - - - - - - - - - - - - - - - - - - - - - - - - - - - - - - -

A second simple example illustrates what happens when the
intepolation goes beyond the range of the data. Run
simpleExample2 and display plotpage Simple_2.

If(xn(n.min)>xn(t) return xn(n.min).
Iif(xn(n.max)<xn(t) return yn(n.max)

simpleExample_2, interpolates data2.cdata, which contains

"n" "xn" "yn"
1	1	0.05
2	2	0.20
3	3	0.60
4	4	0.80
5	5.5	0.95
6	7.0	0.99
.
It uses xnew = scale*(0.5-0.5*sin(t)) to interpolate data2.cdata and
produces ynew. The flatness of ynew at the peaks and troughs of
x new is because the domain of xnew exceeds the domain of xn.


fgen should not be confused with the function generators,
known as fgen_1, fgen_2, etc.

Given y(n) and x(n) (both monotonic or nearly so**) such that y can be
regarded as a function of x, and given YY, find XX such that y(XX)=YY. Uses
Java real function calls. If YY exceeds the range of y, either the minimum
or the maximum x value will be returned as appropriate.
**When back extrapolating from points that were out of range, consecutive
values may be equal.

Generate three monotonic functions y1 (increasing)
and y2 (decreasing), and x increasing.

Generate y3, the function for interpolating y1 and y2
to get x values. For convenience y3 will include the addition of
random increments but will also be monotonic to enable the reverse
values to be calculated as a check.

Find x1(t) and x2(t) such that
y1(x1(t)) = y3(t) and
y2(x2(t)) = y3(t)

Now reverse interpolate to get y1check(t) from x1(t)
and y2check(t) from x2(t).

   Plot in UL panel: y1 vs x, y3 vs x1, and y1check vs x1
                     black    red circles   blue stars
   Plot in UR panel: y2 vs x, y3 vs x2, and y2check vs x2
                     black    red circles   blue stars

   Plot in LL panel  x1 vs y3
   Plot in LR panel  x2 vs y3
Equations
None.
The equations for this model may be viewed by running the JSim model applet and clicking on the Source tab at the bottom left of JSim's Run Time graphical user interface. The equations are written in JSim's Mathematical Modeling Language (MML). See the Introduction to MML and the MML Reference Manual. Additional documentation for MML can be found by using the search option at the Physiome home page.
- Download JSim model MML code (text):
- Download translated SBML version of model (if available):
We welcome comments and feedback for this model. Please use the button below to send comments:
None
Please cite https://www.imagwiki.nibib.nih.gov/physiome in any publication for which this software is used and send one reprint to the address given below:
The National Simulation Resource, Director J. B. Bassingthwaighte, Department of Bioengineering, University of Washington, Seattle WA 98195-5061.
Model development and archiving support at https://www.imagwiki.nibib.nih.gov/physiome provided by the following grants: NIH U01HL122199 Analyzing the Cardiac Power Grid, 09/15/2015 - 05/31/2020, NIH/NIBIB BE08407 Software Integration, JSim and SBW 6/1/09-5/31/13; NIH/NHLBI T15 HL88516-01 Modeling for Heart, Lung and Blood: From Cell to Organ, 4/1/07-3/31/11; NSF BES-0506477 Adaptive Multi-Scale Model Simulation, 8/15/05-7/31/08; NIH/NHLBI R01 HL073598 Core 3: 3D Imaging and Computer Modeling of the Respiratory Tract, 9/1/04-8/31/09; as well as prior support from NIH/NCRR P41 RR01243 Simulation Resource in Circulatory Mass Transport and Exchange, 12/1/1980-11/30/01 and NIH/NIBIB R01 EB001973 JSim: A Simulation Analysis Platform, 3/1/02-2/28/07.