
Rapid exchange of solutes between the vascular and the extravascular space in a whole organ.
Theory
The liver sinusoids are lined by fenestrated endothelial cells.
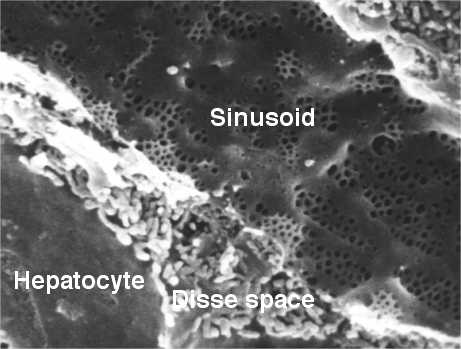
The fenestrae are openings in the endothelial cells with a diameter of about 100 nm, much smaller than the diameter of an erythrocyte (ca. 7 µm). Therefore, erythrocytes do not cross the endothelium, they move along the sinusoids with the velocity of blood:
Indicators such as albumin or sucrose are distributed almost instantaneously between the sinusoidal lumen and the space of Disse. Their movement through the liver sinusoids is characterized by the delayed wave principle, as depicted in the following animation:
The average velocity of these tracers along the liver sinusoids is much less than that of the bulk fluid. This leads to a separation of these tracers from albumin in a similar way as in a chromatographic column.
Assumptions
- Flow is confined to the vascular compartment.
- Diffusional equilibration in the lateral direction is rapid.
- Diffusional transport in the longitudinal direction is negligible.
An amount of label q0 introduced instantaneously at the origin of a sinusoid is carried along by the sinusoidal flow Fs with the velocity vF
Response of a single sinusiodal flow path
The outflow tracer concentration for the vascular reference, (labeled red cells) at the outflow from a sDelayEqinusoid of length L, at time t, is then
where δ stands for a Dirac (impulse) function. The red cell propagates along the length as a traveling wave and emerges at the time LvF. For a diffusible substance equilibrating within its extravascular space at each point along the length, the expected outflow profile will be
where γ is the ratio of its extravascular to its vascular spaces of distribution along the sinusoid. The diffusible tracer flows along the sinusoid with the velocity vF/(1+γ) which is slower than that of the vascular reference.
The Response of the Whole Organ
The relation between the outflow curves from the whole liver for labeled red cells and for each of the diffusible interstitial substances will depend on the relation between the transit times of the large vessels and those of the sinusoids For the liver, it is assumed as a first approximation that large vessel transit times are uniform such that the flow heterogeneity is a reflexion of the flow heterogeneity among the sinusoids.
The relation between the outflow curves for each of the diffusible substances and the vascular reference, is described by the equation,
where t0 is the common large vessel transit time.
Experimental Protocol
The following tracers were injected into the portal vein of an anesthetized dog:
- Erythrocytes (Ery) labeled with 51Cr
- Albumin (Alb) labeled with Evans blue
- Sucrose (Suc) labeled with 14C
- Sodium (22Na)
- Water (3OH1H)
Samples from a hepatic vein were analyzed for gamma radioactivity, and the various isotopes where distinguished by gamma spectrometry.
We welcome comments and feedback for this model. Please use the button below to send comments:
Goresky, CA. A linear method for determining liver sinusoidal and extravascular volumes. Am J Physiol 204: 626-640, 1963.
Author: Andreas J. Schwab (andreas.schwab@mcgill.ca)
Please cite https://www.imagwiki.nibib.nih.gov/physiome in any publication for which this software is used and send one reprint to the address given below:
The National Simulation Resource, Director J. B. Bassingthwaighte, Department of Bioengineering, University of Washington, Seattle WA 98195-5061.
Model development and archiving support at https://www.imagwiki.nibib.nih.gov/physiome provided by the following grants: NIH U01HL122199 Analyzing the Cardiac Power Grid, 09/15/2015 - 05/31/2020, NIH/NIBIB BE08407 Software Integration, JSim and SBW 6/1/09-5/31/13; NIH/NHLBI T15 HL88516-01 Modeling for Heart, Lung and Blood: From Cell to Organ, 4/1/07-3/31/11; NSF BES-0506477 Adaptive Multi-Scale Model Simulation, 8/15/05-7/31/08; NIH/NHLBI R01 HL073598 Core 3: 3D Imaging and Computer Modeling of the Respiratory Tract, 9/1/04-8/31/09; as well as prior support from NIH/NCRR P41 RR01243 Simulation Resource in Circulatory Mass Transport and Exchange, 12/1/1980-11/30/01 and NIH/NIBIB R01 EB001973 JSim: A Simulation Analysis Platform, 3/1/02-2/28/07.