
"A nonlinear model combining Pulmonary Mechanics and Gas Concentration Dynamics." IEEE Trans.,BME-29, 1982, p. 629-641. Lutchen, F.P. Primiano Jr., G.M. Saidel
Description
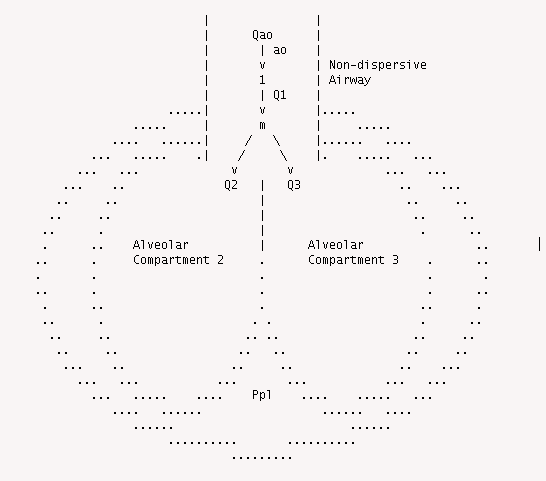
Model Structure with conducting airway {1} and alveolar compartments
{2} and {3}. Qao, Q1, Q2, and Q3 are the flows. {m} is the mixing node.
The conducting airway in Lutchen is non-dispersive. Here it is modeled
as BTEX10 with no axial diffusion.
DESCRIPTION:

   This model simulates "A Nonlinear model combining pulmonary
mechanics and gas concentration dynamics" (Lutchen, et al., 1982,
hereafter referred to as Lutchen).

A non-dispersive airway is connected to a bifurcating  alveolar
compartment. The naming of variables and parameters follows the
nomenclature of the paper. The primary difference between the
model in Lutchen and the model presented here is that the non-
dispersive airway has been simulated by a non-dispersive BTEX10
model (axial diffusion set to zero).

The experiment being simulated is as follows: the human subject
is breathing air. The first breath (inspiration and expiration)
is also air. At the beginning of the second breath, the air is
replaced by pure oxygen for breaths two through seven. It is noted
that Figures 2 and 4 in Lutchen have an incorrect abcissa axis
annotation. The axis is for 7 breaths (7 breaths*4 seconds/breath
equals 28 seconds. Six breaths (shown) would end at 24 seconds.
(There is also a minor error in Equation 19.) The normalized
nitrogen concentration is tracked in both alveolar compartments
and the dead space as washout curves.

The model is run for Lutchen's cases 1 and 6 (Parameter sets Case1
and Case6). Figures 1, 2, and 3 correspond to Lutchen's Figure 2.
Figures 4, 5, and 6 correspond to Lutchen's Figure 4. Text Table
10 (Stat_ plot displayed as text) gives the results of
numerical calculations which may be compared with Lutchen's TABLE
II.

Case 1 is for normal alveolar compartments which have synchronized
flows, concentration changes, and volume changes. The exponential
pressure forcing ranges from 5 mmHg to 9 mmHg.

Case 6 is for obstructive lung disease affecting just the alveolar
compartment labled 3. Using the periodic exponential pressuring forcing,
The obstructed lung has a larger volume with reduced tidal range.
Clearance in the obstructed lung is slower than in the unobstructed
lung.

Case 6 Sine for sinusoidal pressure forcing. The pressure fluctuation
at the mouth has a range of 5 mmHg to 9 mmHg.

The pendelluft fraction is the sum of the two alveolar tidal volumes
minus the tidal volume of the pulmonary system (integrated flow
at the airway opening over an inspiration), all divided by the
tidal volume of the pulmonary system indicates the percentage of
inspired air that is being recirculated in the lungs. In Case 6 Sine,
it accounts for 46% of the ventilation of the obstructed lung.
Pulmonary Tidal Volume * Pendelluft Fraction .434 * 0.200 -------------------------------------------- = -------------- =~0.46. V3T (Tidal Volume) .188
Equations
The equations for this model may be viewed by running the JSim model applet and clicking on the Source tab at the bottom left of JSim's Run Time graphical user interface. The equations are written in JSim's Mathematical Modeling Language (MML). See the Introduction to MML and the MML Reference Manual. Additional documentation for MML can be found by using the search option at the Physiome home page.
- Download JSim model MML code (text):
- Download translated SBML version of model (if available):
- No SBML translation currently available.
- Information on SBML conversion in JSim
We welcome comments and feedback for this model. Please use the button below to send comments:
Please cite https://www.imagwiki.nibib.nih.gov/physiome in any publication for which this software is used and send an email with the citation and, if possible, a PDF file of the paper to:
Or send a copy to:
The National Simulation Resource, Director J. B. Bassingthwaighte, Department of Bioengineering, University of Washington, Seattle WA 98195-5061.
Model development and archiving support at https://www.imagwiki.nibib.nih.gov/physiome provided by the following grants: NIH U01HL122199 Analyzing the Cardiac Power Grid, 09/15/2015 - 05/31/2020, NIH/NIBIB BE08407 Software Integration, JSim and SBW 6/1/09-5/31/13; NIH/NHLBI T15 HL88516-01 Modeling for Heart, Lung and Blood: From Cell to Organ, 4/1/07-3/31/11; NSF BES-0506477 Adaptive Multi-Scale Model Simulation, 8/15/05-7/31/08; NIH/NHLBI R01 HL073598 Core 3: 3D Imaging and Computer Modeling of the Respiratory Tract, 9/1/04-8/31/09; as well as prior support from NIH/NCRR P41 RR01243 Simulation Resource in Circulatory Mass Transport and Exchange, 12/1/1980-11/30/01 and NIH/NIBIB R01 EB001973 JSim: A Simulation Analysis Platform, 3/1/02-2/28/07.