
This model describes the dynamic response of a vessel after a step increase in intraluminal pressure.
Description
  This model describes the dynamic response of a vessel after a step
  increase in intraluminal pressure.  It has been well documented that an
  initial passive distension occurs which is then followed by a
  vasoconstriction to a vessel diameter below that of the initial diameter
  at low pressure.  We have previously developed a model of the myogenic
  response in the resistance vessels which differentiates and defines the
  passive and active diameter responses to pressure (see Ref 1 below).
  Briefly, the passive and active tensions must balance the circumferential
  tension generated by the pressure difference across the vessel wall.  So:

                           Ttot = Tpass + Tact

  where Ttot is the pressure generated circumferential tension governed by
  the Law of Laplace:
                                     P * D
                             Ttot = -------
                                       2

  where P is the intraluminal pressure and D is the vessel diameter.  The
  passive tension is nonlinear with respect to D and has been approximated
  here with an exponential:

               Tpass = Cp1 * exp ( Cp2 * (( D/Dp100 ) - 1) )

  where Cp1 is the passive tension at an intraluminal pressure of 100 mmHg,
  Cp2 describes the steepness of the exponential and Dp100 is the diameter
  of the vessel in a passive state at 100 mmHg.  The active tension can be
  further broken down into two components: A, the degree of activation of
  the VSM (range from 0 to 1) and Tactmax, the active tension generated by
  the VSM in a maximally activated state.  The maximally active tension is
  given by:
                                  _                        _
                                 |   _                 _ 2  |
                                 |  |  (D/Dp100) - Ca2  |   |
            Tactmax = Ca1 * exp < - | ----------------- |    >
                                 |  |_       Ca3       _|   |
                                 |_                        _|

  where Ca1 is the peak active tension, Ca2 is the diameter of the peak
  active tension normalized by the passive vessel diameter at 100 mmHg,
  and Ca3 is the width of the Gaussian normalized by Dp100.  The VSM
  activation is approximated by a sigmoidal function and is given by:

               A = 1 / ( 1 + exp ( -Cmyo*Ttot + Ctone ) )

  where Cmyo determines the sensitivity of the VSM activation to
  circumferential tension and Ctone is the base level of tone that is in
  a vessel without any stimuli.  This previous formulation produces the
  steady state diameter as a function of pressure for a vessel defined by
  the parameters Cp1, Cp2, Dp100, Ca1, Ca2, Ca3, Cmyo and Ctone.  In order
  to model the dynamic response we assume that:

               dD      1       Dc
              ---- = ------ * ---- * ( T - Ttarget )
               dt     taud     Tc

  and

                  dA      1
                 ---- = ------ * ( Atarget - A )
                  dt     taua

  where taud and taua are the time constants of the response, Dc and
  Tc are the control diameter and total vessel wall tension for scaling
  purposes, and Ttarget and Atarget are the steady state tension and
  activation based on the current diameter, D, pressure, P, vessel wall
  tension, T, and VSM activation, A.  The expressions for Ttarget and
  Atarget are given by:
                          _                   _
                         |        (2*T/P)      |
     Ttarget = C1p * exp<  C2p * --------- - 1  >
         		   |_        Dp100      _|
                                     _   _                    _ 2 _
                                    |   | (2*T/P)/Dp100 - C2a  |   |
                    + A * C1a * exp<  - |--------------------- |    >
             	                      |_  |_         C3a        _|  _|

  and

            Atarget = 1 / ( 1 + exp ( -Cmyo*(D*P/2) + Ctone ) )

  In this model the model parameters C1p, C2p, C1a, C2a, C3a, Cmyo and
  Ctone have been set to those optimized to fit the experimental data of
  Davis and Sikes (see Ref 3 and Regulatory Vessel model on the Physiome
  site).  An additional parameter set has been developed where taud and
  taua in addition to the previous parameters and taud and have been
  optimized in a two step process to fit the dynamic data of Sun et al.
  (see Ref 2).  The time constants were first optimized to fit the data
  and then the parameters C1p, C2p, C1a, Cmyo and Ctone were optimized
  at the new taud and taua values.  This process was repeated yeilding a
  very good fit to the eperimental data.  To see this fit load the
  Opt_2_Hill parameter set and run the model.  The fit and data will be
  displayed on the Fit_2_Hill plotpage.
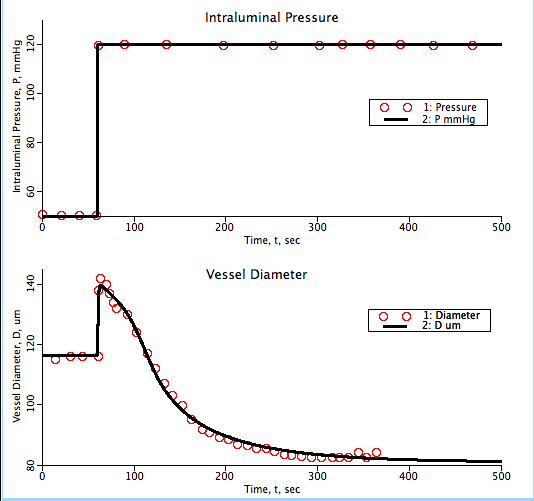
Figure: Model fit to Hill et al. 2000 data. Vessel diameter as function of time in response to change in intraluminal pressure.
Equations
The equations for this model may be viewed by running the JSim model applet and clicking on the Source tab at the bottom left of JSim's Run Time graphical user interface. The equations are written in JSim's Mathematical Modeling Language (MML). See the Introduction to MML and the MML Reference Manual. Additional documentation for MML can be found by using the search option at the Physiome home page.
- Download JSim model MML code (text):
- Download translated SBML version of model (if available):
We welcome comments and feedback for this model. Please use the button below to send comments:
  Carlson BE and Secomb TW: A theoretical model for the myogenic response based on the
  length-tension characteristics of vascular smooth muscle Microcirc 12:327-338, 2005

  Hill MA, Zou H, Davis MJ, Potocnik SJ and Price S: Transient increases in
  diameter and [Ca2+]i are not obligatory for myogenic constriction
  Am J Physiol Heart Circ Physiol 278:345-352, 2000

  Sun D, Huang A, Koller A, Kaley G: Flow-dependent dilation and myogenic
  constriction interact to establish the resistance of skeletal muscle
  arterioles, Microcirc 2:289-295, 1995
Please cite https://www.imagwiki.nibib.nih.gov/physiome in any publication for which this software is used and send one reprint to the address given below:
The National Simulation Resource, Director J. B. Bassingthwaighte, Department of Bioengineering, University of Washington, Seattle WA 98195-5061.
Model development and archiving support at https://www.imagwiki.nibib.nih.gov/physiome provided by the following grants: NIH U01HL122199 Analyzing the Cardiac Power Grid, 09/15/2015 - 05/31/2020, NIH/NIBIB BE08407 Software Integration, JSim and SBW 6/1/09-5/31/13; NIH/NHLBI T15 HL88516-01 Modeling for Heart, Lung and Blood: From Cell to Organ, 4/1/07-3/31/11; NSF BES-0506477 Adaptive Multi-Scale Model Simulation, 8/15/05-7/31/08; NIH/NHLBI R01 HL073598 Core 3: 3D Imaging and Computer Modeling of the Respiratory Tract, 9/1/04-8/31/09; as well as prior support from NIH/NCRR P41 RR01243 Simulation Resource in Circulatory Mass Transport and Exchange, 12/1/1980-11/30/01 and NIH/NIBIB R01 EB001973 JSim: A Simulation Analysis Platform, 3/1/02-2/28/07.