
This model describes the steady state regulatory vessel response to changes in pressure across and shear stress on the vessel wall.
Description
This model describes the steady state response of a regulatory vessel to combinations of changes in transmural pressure and luminal shear stress on the wall. The decreases in vessel diameter in repsonse to increases in pressure is called the 'myogenic response'. Responses to changes in shear stress is called the shear-dependent response. These two responses are local regulatory responses and have been characterized in several experimental studies. Other regulatory responses not included in this model are the metabolic, neuronal and Illustrative Diagram hormonal responses. Regulatory vessels are composed of an inner endothelial layer surrounded by circumferentially oriented vascular smooth muscle (VSM) cells and sheathed with a collagen sleeve. The VSM actively responds to both the pressure difference across the vessel wall and the shear stress on the internal surface of the vessel. The other components of the vessel wall act as a passive non-linear spring in parallel with the active VSM component. The basic model is described below and in more detail in the corresponding paper by Carlson BE and Secomb TW Microcirculation 12:327-338, 2005.
Equations
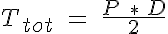
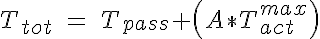
The tension in the vessel wall can be described as the tension in the passive elements of the the vessel wall added to the active VSM tension. These two components must balance the circumferential tension generated by the pressure difference across the vessel wall. So:

where Ttot is the pressure generated circumferential tension governed by the Law of Laplace:
where P is the intraluminal pressure and D is the vessel diameter. The passive tension is nonlinear with respect to D and has been approximated here with an exponential:
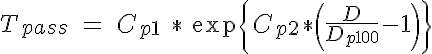
where Cp1 is the passive tension at an intraluminal pressure of 100 mmHg, Cp2 describes the steepness of the exponential and Dp100 is the diameter of the vessel in a passive state at 100 mmHg. The active tension can be further broken down into two components: A, the degree of activation of the VSM (range from 0 to 1) and Tactmax, the active tension generated by the VSM in a maximally activated state. The shape of the maximally active VSM tension curve as a function of diameter based on experimental findings has been found to be Gaussian in form and is given here by:
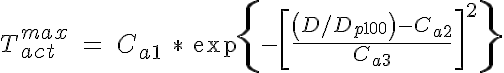
where Ca1 is the peak active tension, Ca2 is the diameter of the peak active tension normalized by the passive vessel diameter at 100 mmHg, and Ca3 is the width of the Gaussian normalized by Dp100. The VSM activation is approximated by a sigmoidal function and is given by:
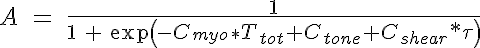
where Cmyo and Cshear determine the sensitivity of the VSM activation to circumferential tension and wall shear stress respectively and Ctone is the base level of tone that is in a vessel without these stimuli. The variable  is the shear stress on the vessel wall. It must be noted that an increase in pressure, increases circumferential tension and then results in an increase in VSM activation and constriction of the vessel. An increase in shear has the opposite response. So now the circumferential tension in the vessel wall, Ttot, can be given by:
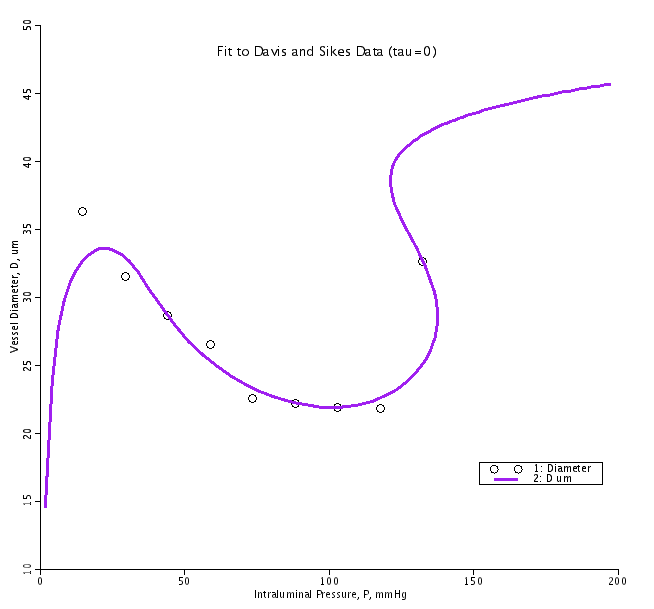
The vessel that is fit by the parameters used in this code is from the data presented in Figure 3 of a study by Davis MJ and Sikes PJ, Amer J Physiol Heart Circ Physiol 259:H1890-H1900, 1990. Other data sets can be fit using different values of Cp1, Cp2, Ca1, Ca2, Ca3, Cmyo, Ctone and Cshear.
- Download JSim model MML code (text):
- Download translated SBML version of model (if available):
The parameter set used in this model has been optimized to fit the pressure-diameter data points from Figure 3 of the referenced Davis and Sikes paper. In their study they determined the steady state vessel diameters over a range of intraluminal pressures with no flow through the vessel. To see the fit in the no flow case run the model and look at the Pres_Diam, Length_Tension and the Fit_to_DS_Data plotpages. To see how changes in shear affect the response curves select the 'Loops' tab at the bottom of the left side of the model and then hit run. You will see curves for 10, 20, 30, 40, 50 and 60 dynes/cm2 in the plotpages. Note that on the Length_Tension plotpage the response are contained between the maximally activated (red) and passive (blue) curves. Also note that the on the Press_Diam plotpage there are multiple diameters that are possible for a given pressure in the high pressure range. The physiological response will not follow the curve shown but will jump from the low diameter to the highest diameter with the intermediate possible diameter representing an unstable vessel diameter.
We welcome comments and feedback for this model. Please use the button below to send comments:
 Carlson BE and Secomb TW; A theoretical model for the myogenic response based on the
 length-tension characteristics of vascular smooth muscle, Microcirc 12:327-338, 2005

 Davis MJ and Sikes PJ; Myogenic responses of isolated arterioles: test for a rate
 sensitive mechanism, Amer J Physiol Heart Circ Physiol 259:H1890-H1900, 1990
Please cite https://www.imagwiki.nibib.nih.gov/physiome in any publication for which this software is used and send one reprint to the address given below:
The National Simulation Resource, Director J. B. Bassingthwaighte, Department of Bioengineering, University of Washington, Seattle WA 98195-5061.
Model development and archiving support at https://www.imagwiki.nibib.nih.gov/physiome provided by the following grants: NIH U01HL122199 Analyzing the Cardiac Power Grid, 09/15/2015 - 05/31/2020, NIH/NIBIB BE08407 Software Integration, JSim and SBW 6/1/09-5/31/13; NIH/NHLBI T15 HL88516-01 Modeling for Heart, Lung and Blood: From Cell to Organ, 4/1/07-3/31/11; NSF BES-0506477 Adaptive Multi-Scale Model Simulation, 8/15/05-7/31/08; NIH/NHLBI R01 HL073598 Core 3: 3D Imaging and Computer Modeling of the Respiratory Tract, 9/1/04-8/31/09; as well as prior support from NIH/NCRR P41 RR01243 Simulation Resource in Circulatory Mass Transport and Exchange, 12/1/1980-11/30/01 and NIH/NIBIB R01 EB001973 JSim: A Simulation Analysis Platform, 3/1/02-2/28/07.