
Compartmental cardiovascular indicator dilution model ported from Rideout (ACSL programs IND-DIL). Also in MATLAB.
Further reading: Rideout section 3.4, pages 43-57; and problems 3.3, 3.4 and 3.5 pages 65-66.
Description
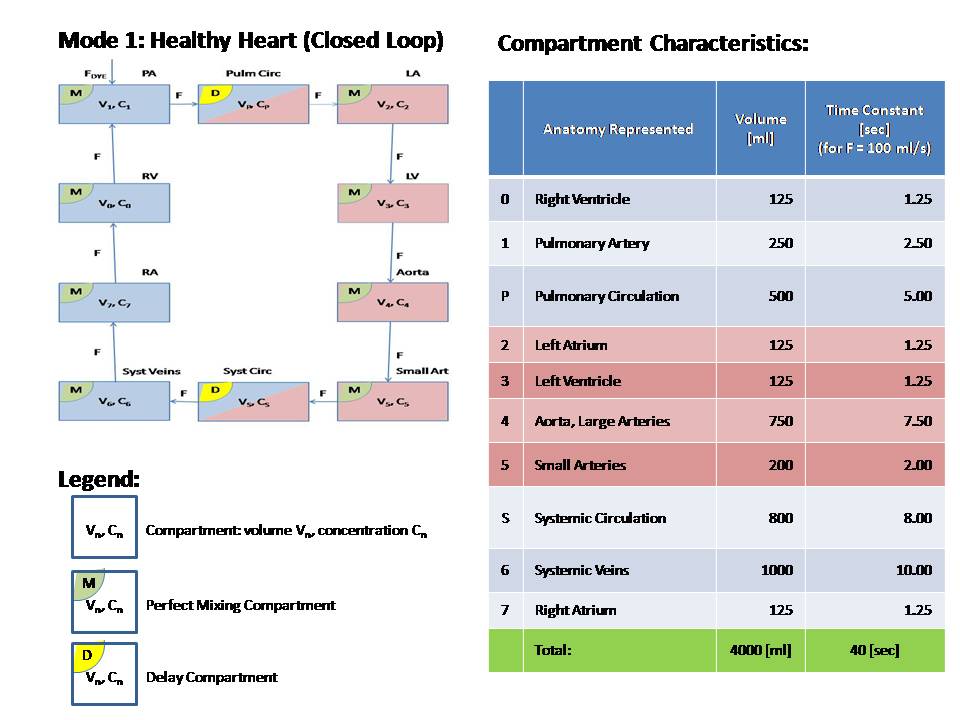
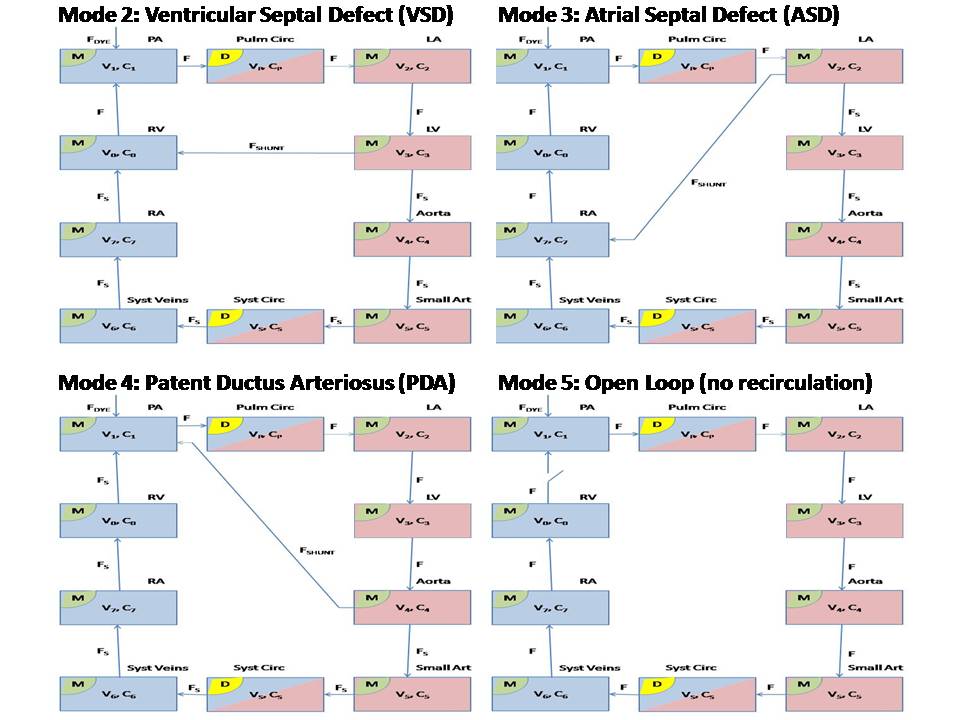
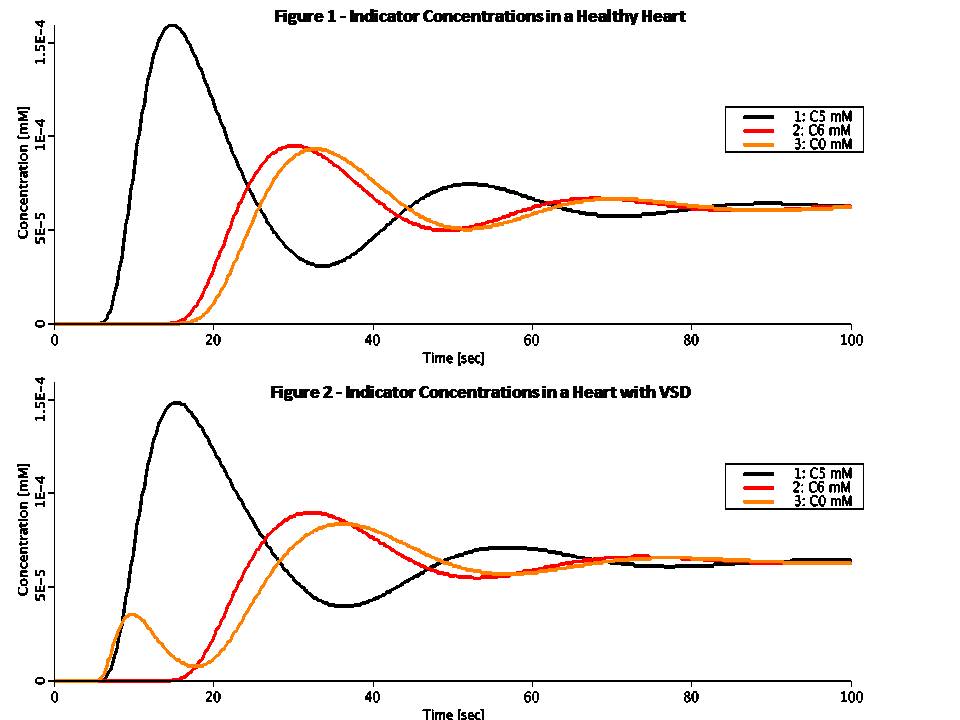
This model simulates the human cardiovascular system. It simulates the
following five scenarios:
(1) Healthy Heart (with recirculation)
(2) Ventricular Septal Defect (VSD)
(3) Atrial Septal Defect (ASD)
(4) Patent Ductus Arteriosus (PDA)
(5) Open Loop (no recirculation)

The model is made of 10 compartments which combine perfect mixing and
delay compartments. The anatomy represented by each compartment, as
well as its volume and time constant are shown in the table above. This
is a simple model which ignores capillary diffusion. An indicator bolus
is injected into the pulmonary artery (compartment 1) and recirculates
through the compartments in modes 1 through 4. However, mode 5, which
is non-physiological, includes clearance through the right ventricle
(compartment 0) and no recirculation.

For closed loop modes, by conservation of mass, the total amount of
indicator in all compartments is fixed. Initially we expect to see the
concentration peak in each compartment with the accumulated delays as
shown in the table. The Transport Time around the loop is 40 sec. We
therefore expect all compartments to show a peak-to-peak delay of ~40
sec (as long as the second peak can be distinguished). Eventually, the
indicator concentrations will flatten into a unified concentration in
all compartments.

In a healthy heart (mode 1) there are no internal loops. Blood flows
from compartment to compartment in series. Figure 1 shows indicator
concentrations in a healthy heart as computed by the JSim model. Note,
for example, the indicator concentration at the small arteries
(compartment 5). It peaks at ~15 sec, and again at ~52 sec. The
peak-to-peak of ~37 sec is close to 40 sec as we expect. Also note that
all concentrations flatten at ~0.00006 mM, the amount of injected
indicator (0.25 umol) divided by total volume (4000 ml).

In a diseased heart (modes 2 through 4), there is an additional inner
loop which flows in parallel to the outer loop and disrupts normal
function. One or more of the conditions VSD, ASD or PDA can exist,
although in this model we study the effect of each separately.

Two septal defects are studied in this model. Ventricular Septal Defect
(mode 2), includes a shunt flow, Fshunt, from the left ventricle
(compartment 3) to the right ventricle (compartment 0). Atrial Septal
Defect (mode 3), includes a shunt flow, Fshunt, from the left atrium
(compartment 2) to the right atrium (compartment 7). Figure 2 shows
indicator concentrations in a heart with VSD as computed by the JSim
model. Note the early peak in C0 due the shunt. In general, the effect
of VSD or ASD is to generate lower peaks that occur later in time as the
VSD or ASD aperture increases.

Rideout uses the pulmonary flow as a constant reference (F = 100 ml/s
by default). This poses a design limitation with VSD or ASD (modes 2
and 3). In both cases Fs = F - Fshunt and therefore Fshunt cannot
exceed F. The code includes a protection mechanism which limits Fshunt
to 99% of F in order to prevent near-zero or negative systemic flow.

Patent Ductus Arteriosus (mode 4), includes a shunt flow, Fshunt, from
the aorta (compartment 4) to the pulmonary artery (compartment 1). In
this mode the reference flow is the systemic flow, and there is no risk
of negative flow. The pulmonary flow is F = Fs + Fshunt.

Open loop (mode 5) is a non-physiological form of the cardiovascular
system in which the effects of recirculation are subtracted off in
some way. The injected indicator will eventually be cleared from the
system through compartment 0.

Open loop is useful for studying the cardiac output and system volume.
By conservation of mass, the same amount of indicator will go through
each compartment. The total area under the indicator injection pulse,
as well as the area under each concentration curve (time integral at
infinity) is a constant. Since the default amount of injected indicator
is 0.25 umol and average flow is 100 ml/s, area default is 0.0025 mM*s.
In open loop, we also compute Transport Functions, Hn(t), which
represent the fraction of solute arriving at the output of compartment
n per unit of time. Finally, we compute Average Transit Times, TAn(t),
from compartment 1 to any compartment n. This is the first moment of
the corresponding Transport Function Hn(t). Multiplying the final
value of the Average Transit Time by the flow F0 yields the aggregate
volume of blood of the compartments 1 through n.
Equations
The equations for this model may be viewed by running the JSim model applet and clicking on the Source tab at the bottom left of JSim's Run Time graphical user interface. The equations are written in JSim's Mathematical Modeling Language (MML). See the Introduction to MML and the MML Reference Manual. Additional documentation for MML can be found by using the search option at the Physiome home page.
- Download JSim model MML code (text):
- Download translated SBML version of model (if available):
- No SBML translation currently available.
- Information on SBML conversion in JSim
Download MATLAB model M-file
We welcome comments and feedback for this model. Please use the button below to send comments:
Rideout VC. Mathematical computer modeling of physiological systems.
Prentice Hall, Englewood Cliffs, NJ, 1991, Section 3.4, pp. 43-57; and
problems 3.3, 3.4 and 3.5 pp. 65-66
Please cite https://www.imagwiki.nibib.nih.gov/physiome in any publication for which this software is used and send an email with the citation and, if possible, a PDF file of the paper to:
Or send a copy to:
The National Simulation Resource, Director J. B. Bassingthwaighte, Department of Bioengineering, University of Washington, Seattle WA 98195-5061.
Model development and archiving support at https://www.imagwiki.nibib.nih.gov/physiome provided by the following grants: NIH U01HL122199 Analyzing the Cardiac Power Grid, 09/15/2015 - 05/31/2020, NIH/NIBIB BE08407 Software Integration, JSim and SBW 6/1/09-5/31/13; NIH/NHLBI T15 HL88516-01 Modeling for Heart, Lung and Blood: From Cell to Organ, 4/1/07-3/31/11; NSF BES-0506477 Adaptive Multi-Scale Model Simulation, 8/15/05-7/31/08; NIH/NHLBI R01 HL073598 Core 3: 3D Imaging and Computer Modeling of the Respiratory Tract, 9/1/04-8/31/09; as well as prior support from NIH/NCRR P41 RR01243 Simulation Resource in Circulatory Mass Transport and Exchange, 12/1/1980-11/30/01 and NIH/NIBIB R01 EB001973 JSim: A Simulation Analysis Platform, 3/1/02-2/28/07.