
Left heart and systemic arteries pressure-flow model ported from Rideout (ACSL programs LH-PF). Also in MATLAB.
Further reading: Rideout's section 4.2, pages 78-90.
Description
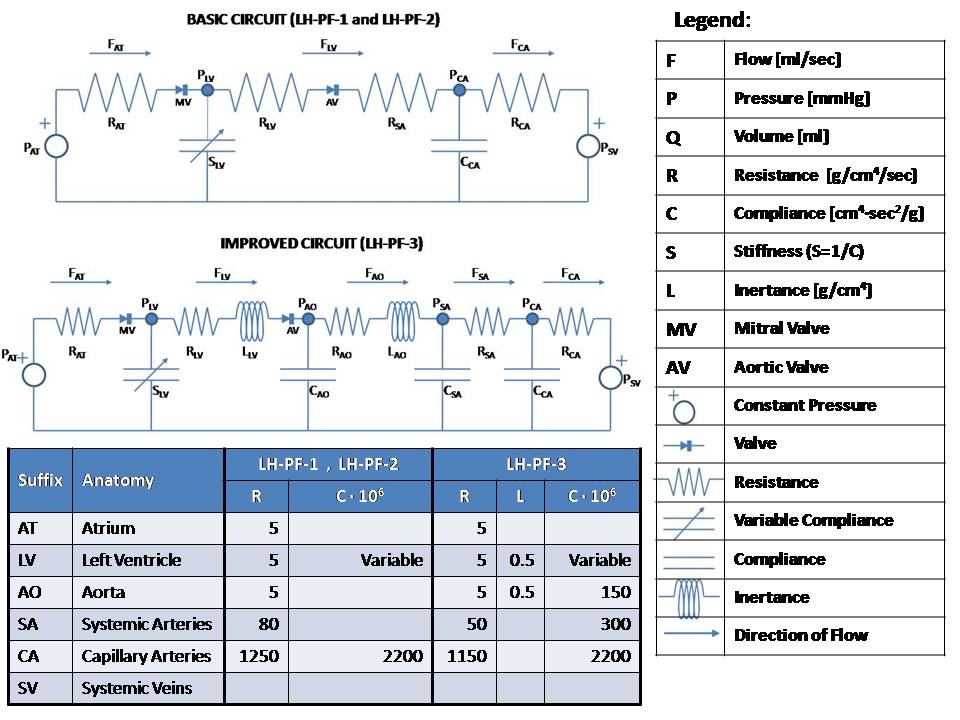
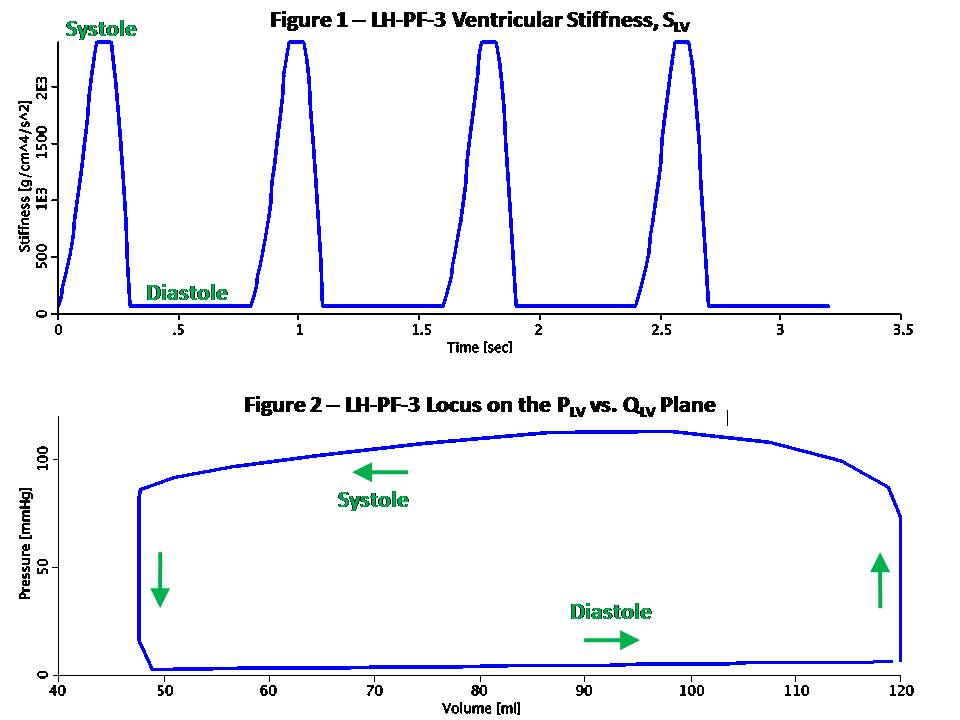
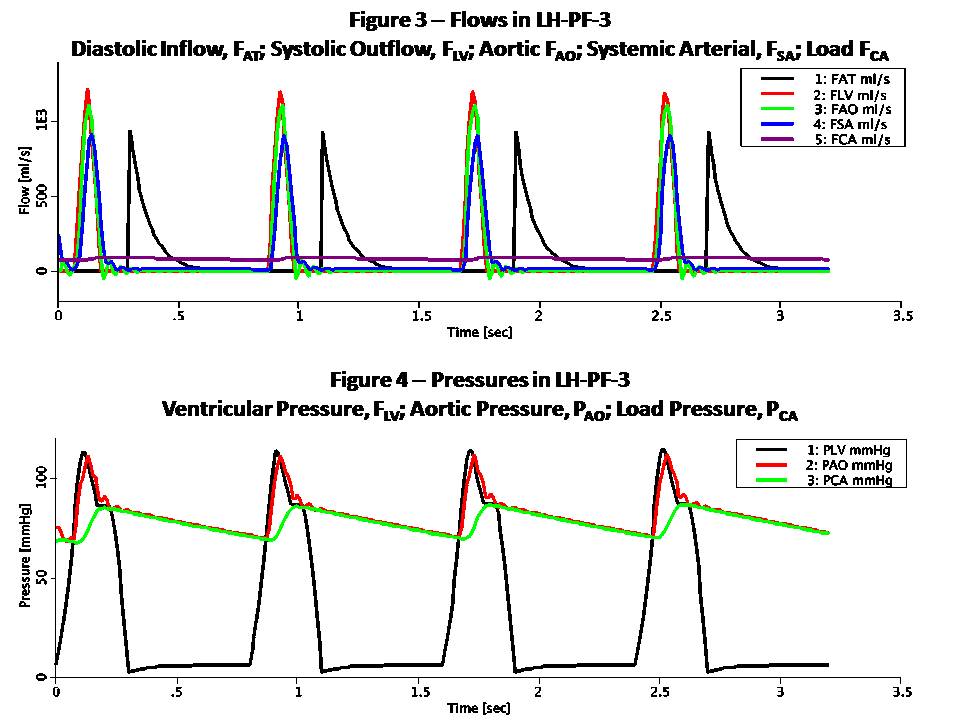
This model simulates the left heart using Pressure-Flow-Volume (or
Pressure-Flow for short) modeling. This technique takes advantage of the
analogy to RC or RLC circuits as shown here:

Pressure-Flow-Volume             Electrical Circuit Equivalent
------------------------------------------------------------------
F  Flow (ml/s)                   I  Current (Amper)
P  Pressure (mmHg or g/cm/s^2)   V  Voltage (Volt)
Q  Volume (ml)                   Q  Charge (Coulomb or Amper*s)
R  Resistance (g/cm^4/s)         R  Resistance (Ohm or Volt/Amper)
C  Compliance (cm^4*s^2/g)       C  Capacitance (Farad or s/Ohm)
L  Inertance (g/cm^4)            L  Inductance (Henry or s*Ohm)

Pressure-Flow components obey the same fundamental equations as
their RLC circuit equivalents, i.e.:

P = R * F                        V = R * I    (Eq. 1 or Ohm's Law)
P = L * F:t                      V = L * I:t  (Eq. 2)
P = Q / C                        V = Q / C    (Eq. 3)
F = Q:t                          I = Q:t      (Eq. 4)

Blood flows from the left atrium to the left ventricle via the mitral
valve and continues to the aorta via the aortic valve. The load consists
of systemic and capillary arteries. Atrial pressure (PAT) is assumed
fixed at 6 mmHg as is the central venous pressure (PSV) at 3 mmHg. These
are equivalent to input and output electric potentials (voltages) which
drive the flow (current) through the left heart. Mitral and aortic
valves are modeled by limiting the flow to be positive and less than an
upper bound.

There are three separate modes implemented in this model, corresponding
to Rideout's ACSL programs:
(1) LH-PF-1: Rectangular Actuator
(2) LH-PF-2: Clipped Half-Sine
(3) LH-PF-3: Skewed Half-Sine and Inertance

LH-PF-1 and LH-PF-2 use a basic RC circuit; LH-PF-3 uses an RLC circuit
with additional components. The actuating signal for all modes is a
variable periodic left ventricular stiffness SLV (SLV = 1/CLV) which
simulates a contracting and expanding left ventricle during the cardiac
cycle. LH-PF-1 uses a rectangular SLV stiffness SLV waveform. LH-PF-2
uses a clipped half-sine. LH-PF-3 uses a clipped half-sine with a second
harmonic term which adds some skew to the waveform.

The figures show some results when running the JSim model in LH-PF-3.
Figure 1 is the ventricular stiffness, SLV. Stiffness changes between a
maximum, SLS during systole which lasts 0.3 sec, and a minimum, SLD
during diastole which last 0.5 sec. The pulse is periodic with a period
of 0.8 sec (corresponding to 75 beats/min heart pulse). Four heart beats
are simulated for a total run time of 3.2 sec. The left ventricle
volume, QLV expands during diastole and contracts during systole.

Figure 2 shows the locus (path) of the left ventricular pressure, PLV,
plotted versus volume, QLV. Values in this model were chosen so that the
end-diastolic volume (EDV) is 120 ml and the end-systolic volume (ESV)
is 48 ml. These volumes can be derived from Equation 3, P = Q / C, or
Q = P / S and are typical in a healthy human adult. The ejection
fraction (EDV - ESV) / EDV is 60% and stroke volume EDV - ESV is 72 ml.
At a heart pulse of 0.8 sec, this corresponds to a cardiac output of
90 ml/sec (5.4 liter/min). The locus is traversed in counterclockwise
direction. Note that it lies between the lines whose slopes are the
diastolic (minimum) muscle stiffness SLD and the systolic (maximum)
stiffness, SLS.

Figure 3 shows various flows in the model. Note that FAT, the atrial
flow rises then decays exponentially at diastole. This represents the
diastolic inflow, which occurs when the walls of the left ventricle
are relaxed and flow can pass through the mitral valve. As this chamber
fills and expands, FAT decays. FLV, FAO and FSA have reverse activity,
peaking and decaying during systole. FLV is the ventricular outflow and
is limited by the aortic valve. FCA, capillary arteries flow, represents
the systemic load and is much smaller and less pulsatile.

Figure 4 shows various pressures in the model. PLV, the ventricular
pressure increases during systole, closing the mitral valve, and with
further increase opens the aortic valve. Aortic pressure PAO follows
ventricular pressure PLV during systole, while load pressure PCA is
much more rounded. During diastole, PAO and PCA nearly coincide. The
slow exponential decay has a time constant TCA = RCA * CCA of 2.53 sec.
Note that some oscillations are visible in PAO starting at the end of
systole.
Equations
The equations for this model may be viewed by running the JSim model applet and clicking on the Source tab at the bottom left of JSim's Run Time graphical user interface. The equations are written in JSim's Mathematical Modeling Language (MML). See the Introduction to MML and the MML Reference Manual. Additional documentation for MML can be found by using the search option at the Physiome home page.
- Download JSim model MML code (text):
- Download translated SBML version of model (if available):
We welcome comments and feedback for this model. Please use the button below to send comments:
Rideout VC. Mathematical computer modeling of physiological
systems. Englewood Cliffs, NJ: Prentice Hall, 1991, 261 pp.
Please cite https://www.imagwiki.nibib.nih.gov/physiome in any publication for which this software is used and send one reprint to the address given below:
The National Simulation Resource, Director J. B. Bassingthwaighte, Department of Bioengineering, University of Washington, Seattle WA 98195-5061.
Model development and archiving support at https://www.imagwiki.nibib.nih.gov/physiome provided by the following grants: NIH U01HL122199 Analyzing the Cardiac Power Grid, 09/15/2015 - 05/31/2020, NIH/NIBIB BE08407 Software Integration, JSim and SBW 6/1/09-5/31/13; NIH/NHLBI T15 HL88516-01 Modeling for Heart, Lung and Blood: From Cell to Organ, 4/1/07-3/31/11; NSF BES-0506477 Adaptive Multi-Scale Model Simulation, 8/15/05-7/31/08; NIH/NHLBI R01 HL073598 Core 3: 3D Imaging and Computer Modeling of the Respiratory Tract, 9/1/04-8/31/09; as well as prior support from NIH/NCRR P41 RR01243 Simulation Resource in Circulatory Mass Transport and Exchange, 12/1/1980-11/30/01 and NIH/NIBIB R01 EB001973 JSim: A Simulation Analysis Platform, 3/1/02-2/28/07.