
CV loop with baroreceptor regulation ported from Rideout (ACSL program PF-1-REG). Also in MATLAB.
Further reading: Rideout's section 4.5, pages 109-117.
Description
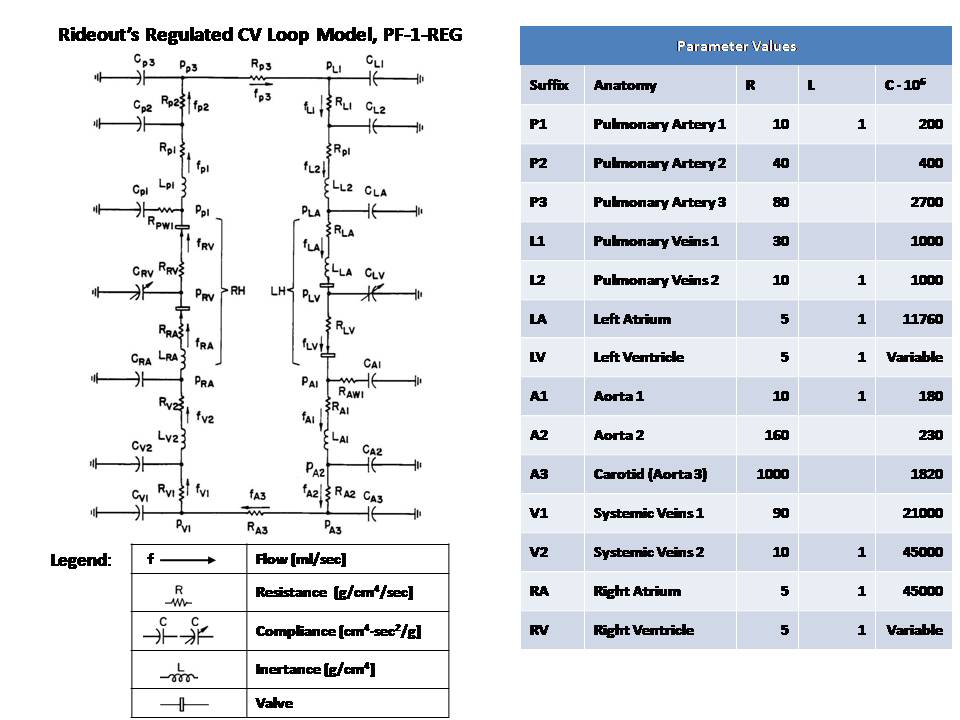
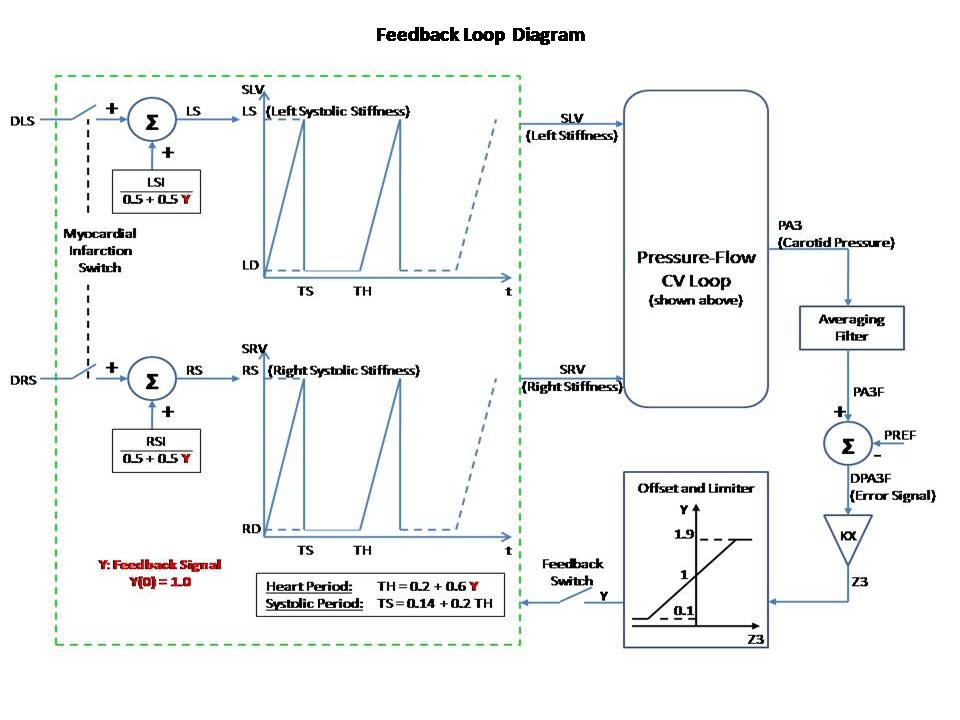
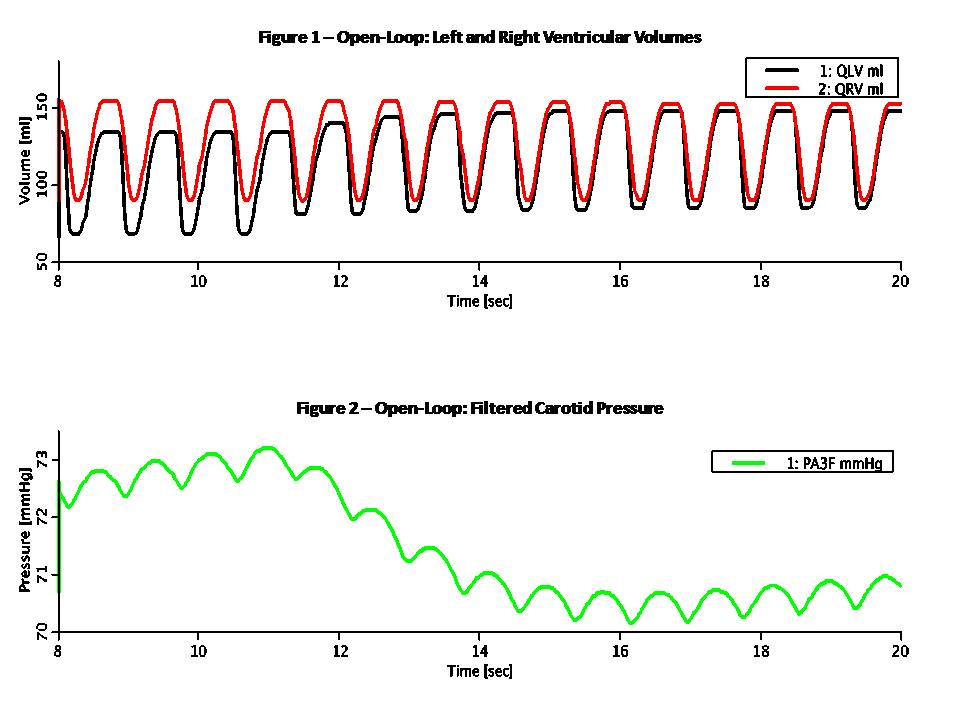
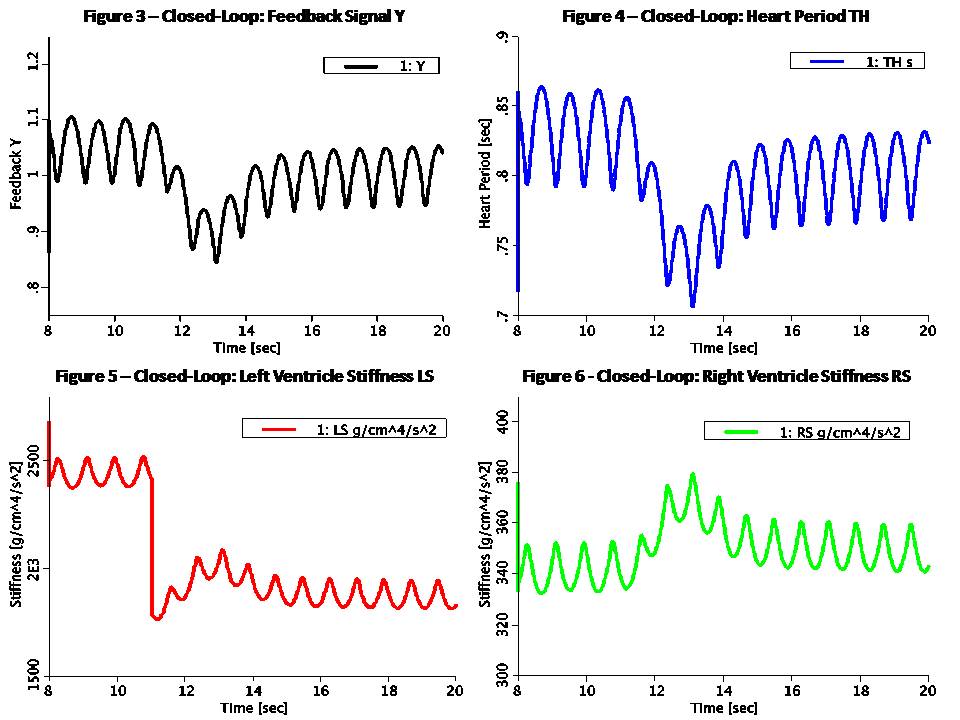
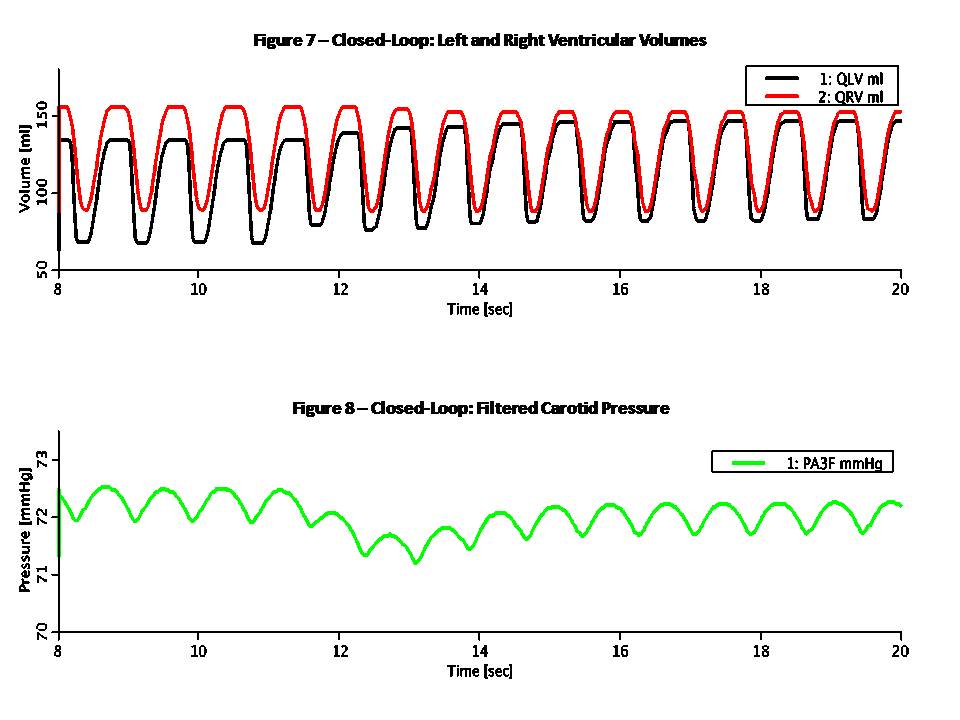
This Pressure-Flow model of the CV loop is regulated with baroreceptor
feedback. It is similar to Rideout's uncontrolled CV loop model PF-1,
ported to JSim in model Rideout_PressureFlow1. Despite the uncontrolled
nature of that model, the Frank-Starling mechanism ensures stability.
More robust stability, however, requires regulation or feedback.

The present model simulates one of the body's important homeostatic
mechanisms to maintain blood pressure. Known as baroreflex, it is a
negative feedback loop with connections to the central nervous system
(CNS). Pressure sensors called baroreceptors are located in the carotid
(aortic) arch. Afferent nerves carry signals from these sensors to the
CNS and efferent nerves carry signals back to the heart. There are two
branches of efferent nerves with opposing effects: sympathetic which
elevate blood pressure and parasympathetic which lower it.

Baroreceptor regulation can be described as follows:
* If blood pressure increases:
  - Baroreceptors activated
  - Parasympathetic nerves activated, sympathetic inactivated
  - Heart rate and strength of contraction decrease
  - Blood pressure drops (returns to normal)
* If blood pressure drops:
  - Baroreceptors inactivated
  - Parasympathetic nerves inactivated, sympathetic activated
  - Heart rate and strength of contraction increase
  - Blood pressure increases (returns to normal)

A JSim choice variable is used to switch between open-loop (without
baroreceptor feedback) and closed-loop (with feedback). Left and right
ventricle stiffnesses SLV and SRV (S = 1 / C) in this model use a
half-sine pulse with a second harmonic added to shape the actuator more
realistically. With open-loop, these waveforms are periodic, with
systole lasting TS = 0.3 sec and diastole 0.5 sec, such that the heart
period is TH = 0.8 sec (corresponding to 75 beats/min). Peak amplitude
is LS = 2500 g/cm^4/s^2 for the left ventricle and RS = 350 g/cm^4/s^2
for the right ventricle.

With closed-loop, a feedback signal Y is derived from PA3, corresponding
approximately to carotid pressure. The following steps are taken:
1) Average PA3 using a low-pass filter. Filtered output, PA3F, tracks
   PA3, but changes less rapidly.
2) Calculate an error signal, DPA3F, as the difference between PA3F and
   a constant reference PREF = 72 mmHg. Error signal may be positive or
   negative, according to whether the average carotid pressure is
   greater or less than PREF.
3) Scale the error signal with a constant gain KX = 0.2 1/mmHg. Scaled
   output, Z3, is dimensionless.
4) Apply an offset and limit the error Z3 to obtain the feedback signal
   Y. Offset is 1.0, lower limit is 0.1 and upper limit 1.9. Thus, Y is
   unity when there is no error and has a maximum allowed deviation of
   0.9 about unity.

The goal of the feedback loop is to maintain the feedback signal Y as
close as possible to unity. Y is used to control the systolic amplitudes
LS and RS, heart period TH and systolic period TS using these equations:

LS = LSI / (0.5 + 0.5 Y)   (Eq. 1)
RS = RSI / (0.5 + 0.5 Y)   (Eq. 2)

TH = 0.2  + 0.6 Y          (Eq. 3)
TS = 0.14 + 0.2 TH         (Eq. 4)

With the feedback at unity, these values default to the open-loop
values. An increase in Y, which might result from an increase in carotid
pressure, will tend to increase heart period (decrease heart rate) and
also decrease strengths of contraction of both ventricles. The result of
these changes will tend to return arterial pressures, and thus cardiac
output, back to their original values.

This model may be used to study the effect of myocardial infarction of
one or both ventricles introduced at a chosen time. The infarction is
simulated by adding negative values DLS and DRS to the systolic
ventricle stiffnesses LS and RS respectively at a chosen time. The
model also allows study of arterial infusion or venous bleeding.

The figures examine open and closed loop behavior with total run time of
20 sec. A sudden myocardial infarction is introduced at time TI = 11 sec
in the left ventricle. By setting DLS = 625, stiffness drops 25% from
approximately 2500 g/cm^4/s^2 to 1875 g/cm^4/s^2. Figures 1 and 2 are
in open loop mode; the rest of the figures are closed loop.

Figure 1 shows ventricular volumes, QLV and QRV. Stroke volume from the
left ventricle is decreased at infarction time from approx. 68 ml to 55
ml. A slow recovery begins to occur as average volumes and pressures
increase. By Frank-Starling's Law, stroke volume rises and at t = 20 sec
it is approx. 63 ml.

Figure 2 demonstrates that without true feedback, some variables cannot
return to their pre-infarction value. The carotid pressure, for example,
drops from an approx. average of 72.5 to 70.5 mmHg.

Figures 3 and 4 show the feedback signal Y and heart period TH in closed
loop. Both plots show a dip at 11 sec. Since the error signal DPA3F is
negative, Y drops below unity. From feedback equations 3 and 4 above,
heart period and systole period drop with Y (heart rate increases).
Within approx. 4 sec, Y returns to near unity and TH returns to the
open loop stable value of 0.8 sec. Thus the feedback loop was able to
compensates for the infarction relatively rapidly.

Figures 5 and 6 show the left ventricle systolic stiffness LS and right
ventricle systolic stiffness RS. From feedback equations 1 and 2 above,
both increase when Y drops below unity. The increase in contraction
strength contributes to the recovery. As Y returns to unity, LS and RS
stablize with means near 1875 g/cm^4/s^2 and 350 g/cm^4/s^2.

Figures 7 shows ventricular volumes QLV and QRV. It is similar to the
open-loop result of Figure 1, but recovery is faster.

Figure 8 shows the filtered carotid pressure in closed-loop. Unlike the
corresponding open-loop result of Figure 2, PA3F returns near its value
before infarction, centered at the reference point of PREF = 72 mmHg.
Equations
The equations for this model may be viewed by running the JSim model applet and clicking on the Source tab at the bottom left of JSim's Run Time graphical user interface. The equations are written in JSim's Mathematical Modeling Language (MML). See the Introduction to MML and the MML Reference Manual. Additional documentation for MML can be found by using the search option at the Physiome home page.
- Download JSim model MML code (text):
- Download translated SBML version of model (if available):
Download MATLAB model M-file
We welcome comments and feedback for this model. Please use the button below to send comments:
Rideout VC. Mathematical computer modeling of physiological systems.
Prentice Hall, Englewood Cliffs, NJ, 1991, Section 4.5, pp. 109-117
Please cite https://www.imagwiki.nibib.nih.gov/physiome in any publication for which this software is used and send one reprint to the address given below:
The National Simulation Resource, Director J. B. Bassingthwaighte, Department of Bioengineering, University of Washington, Seattle WA 98195-5061.
Model development and archiving support at https://www.imagwiki.nibib.nih.gov/physiome provided by the following grants: NIH U01HL122199 Analyzing the Cardiac Power Grid, 09/15/2015 - 05/31/2020, NIH/NIBIB BE08407 Software Integration, JSim and SBW 6/1/09-5/31/13; NIH/NHLBI T15 HL88516-01 Modeling for Heart, Lung and Blood: From Cell to Organ, 4/1/07-3/31/11; NSF BES-0506477 Adaptive Multi-Scale Model Simulation, 8/15/05-7/31/08; NIH/NHLBI R01 HL073598 Core 3: 3D Imaging and Computer Modeling of the Respiratory Tract, 9/1/04-8/31/09; as well as prior support from NIH/NCRR P41 RR01243 Simulation Resource in Circulatory Mass Transport and Exchange, 12/1/1980-11/30/01 and NIH/NIBIB R01 EB001973 JSim: A Simulation Analysis Platform, 3/1/02-2/28/07.