
The Selkov model for glycolysis exhibits a Hopf bifurcation. As the b parameter increases from 0.25 to 0.95, the model switches from a stable equilibrium point to a limit cycle near b=0.41 and back to a stable equilibrium point near b=0.8.
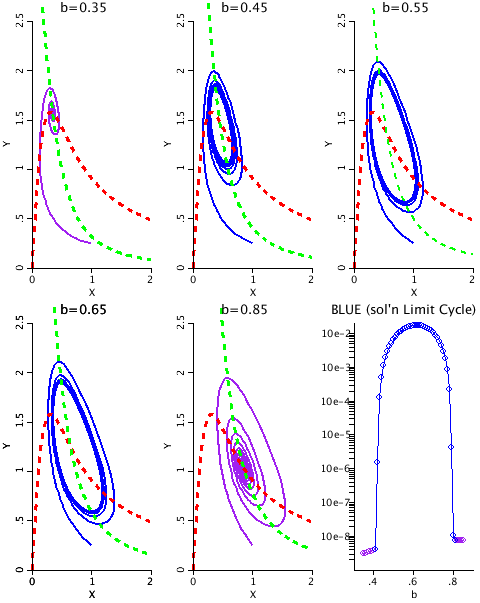
Figure 1: The phase plane plots showing oscillatory behavior.
Description
This is a model showing oscillatory behavior in a chemical reaction with just two species.
PHASE PLANE PLOTS
Nullclines are plotted in dashed red (dx/dt=0) and dashed green (dy/dt=0).
Stable solutions are plotted in magenta (b=0.35, b=0.85)
Limit Cycles are plotted in blue (b=0.45, b=0.55, b=0.65).
Plow lower right corner: The standard deviation of the last half of the solutions were calculated for X and Y and the product, LC, was plotted as a function of b. Where LC is small, the solution has a stable steady state (Magenta circles). Where LC gets large, the solution is a limit cycle (Blue circles).
The appearance and disappearance of a periodic orbit through a local change in the stability properties of a steady point is known as a Hopf bifurcation. The Hopf bifurcations occur at approximately b=0.41 and b= 0.80 when a=0.1;
TIME COURSE PLOTS
There are 6 plots corresponding to 6 values of b. x is plotted in black, y in red.
Note that far away from the transition points the solutions converge rapidly (R=0.35, transition at 0.41). Close to the transition points the solutions converge more slowly (r=0.81, transition at 0.80). As the solution switches from stable solutions to Limit Cycles back to stable solutions, the size of the Limit cycles begins small, grows to a maximum and then shrinks back to zero. (r=0.42, r=0.55, r=0.65, and r=0.79).
Equations
Selkov model equations
The equations for this model may be viewed by running the JSim model applet and clicking on the Source tab at the bottom left of JSim's Run Time graphical user interface. The equations are written in JSim's Mathematical Modeling Language (MML). See the Introduction to MML and the MML Reference Manual. Additional documentation for MML can be found by using the search option at the Physiome home page.
- Download JSim model MML code (text):
- Download translated SBML version of model (if available):
- No SBML translation currently available.
- Information on SBML conversion in JSim
We welcome comments and feedback for this model. Please use the button below to send comments:
Selkov, E., Model of glycolytic oscillations, (1968) Eur. J. Biochem. 4, 79-86.

Strogatz, SH, Nonlinear Dynamics and Chaos, Addison-Wesley,
Reading, MA, (1994). (see pages 205-207)
Please cite https://www.imagwiki.nibib.nih.gov/physiome in any publication for which this software is used and send one reprint to the address given below:
The National Simulation Resource, Director J. B. Bassingthwaighte, Department of Bioengineering, University of Washington, Seattle WA 98195-5061.
Model development and archiving support at https://www.imagwiki.nibib.nih.gov/physiome provided by the following grants: NIH U01HL122199 Analyzing the Cardiac Power Grid, 09/15/2015 - 05/31/2020, NIH/NIBIB BE08407 Software Integration, JSim and SBW 6/1/09-5/31/13; NIH/NHLBI T15 HL88516-01 Modeling for Heart, Lung and Blood: From Cell to Organ, 4/1/07-3/31/11; NSF BES-0506477 Adaptive Multi-Scale Model Simulation, 8/15/05-7/31/08; NIH/NHLBI R01 HL073598 Core 3: 3D Imaging and Computer Modeling of the Respiratory Tract, 9/1/04-8/31/09; as well as prior support from NIH/NCRR P41 RR01243 Simulation Resource in Circulatory Mass Transport and Exchange, 12/1/1980-11/30/01 and NIH/NIBIB R01 EB001973 JSim: A Simulation Analysis Platform, 3/1/02-2/28/07.