
Calculation of the apparent pKa for the CO2 hydration reaction in turtle blood. Empirical equations relating pKa to pH, Temperature, Na+, protein conc, and ionic strength and CO2 solubility coefficient to temperature.
Description
   Hydration of CO2 yields HCO3- via the reaction:
         CO2 + H2O <-> H2CO3 <-> HCO3- + H+ <-> (CO3)2- + 2H+.
Acid–base physiologists traditionally simplify the reaction by omitting the H2CO3 term
and lumping all ionic CO2 species into the HCO3- term. The simplified reaction forms
the basis for the familiar Henderson–Hasselbalch equation of the CO2–HCO3- buffer
system:
         pH = pKa + log( [HCO3-]/(alphaCO2*PCO2) ),
where alphaCO2 is the solubility coefficient relating [CO2] and PCO2 (partial pressure of CO2)
using Henry’s Law. The apparent pK (pKa) in this equation lacks a rigorous thermodynamic
definition. Instead, it is an empirical factor relating pH, the product of alphaCO2 and PCO2,
and the apparent [HCO3-] (i.e. the sum of all ionic CO2 species).
   alphaCO2 and pKa are sensitive to the temperature, pH and/or the ionic strength of the
reaction medium. alphaCO2 and pKa of normal mammalian blood plasma have been well
defined over a range of temperatures and pH values (e.g. Severinghaus, 1965; Siggaard-
Andersen, 1974; Reeves, 1976). These mammalian values are commonly used in
analyses of the acid–base status of non-mammalian species, despite evidence that such
practices can produce misleading results (Nicol et al. 1983). As an alternative, Heisler
(1984; erratum in Heisler, 1986) developed complex equations for alphaCO2
(mmol/(L*mmHg)) (1 mmHg = 133.22Pa) and pKa that are purported to be generally
applicable to aqueous solutions (including body fluids) between 0 and 40°C and
incorporate the molarity of dissolved species (Md), solution pH, temperature (T, °C),
sodium concentration ([Na+], mol/L), ionic strength of nonprotein ions (I, mol/L) and
protein concentration ([Pr], g/L).
   pKa and alphaCO2 data were acquired from sea turtle plasma and compared to an empirically
derived pKa equation and to two CO2 solubility equations: one adapted from Heisler 1986
and the other from Christmas and Bassingthwaighte 2017.
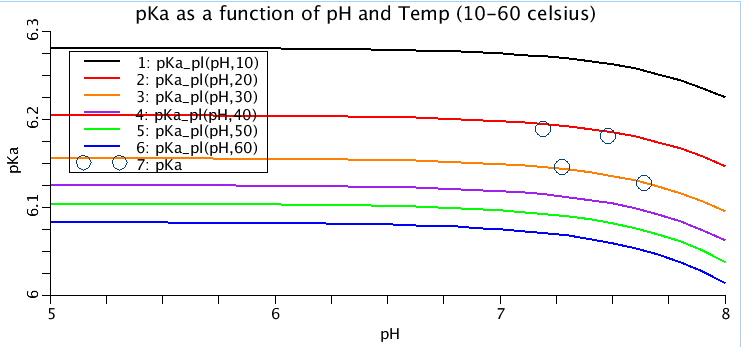
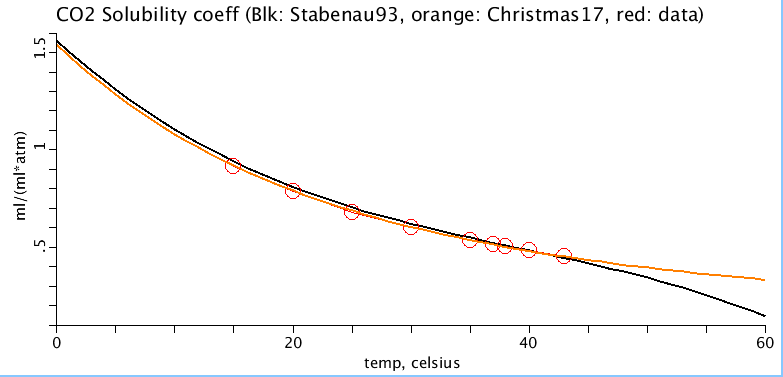
Figure: (top) pKa as a function of temperature and pH. Each line represents the pKa at a different temperature, in increments of 10 degrees celsius. The four circles represent experimentally measured values in sea turtle plasma. (bottom) CO2 solubility coefficient, alphaCO2, (ml oxygen per ml of plasma per atmosphere) as a function of temperature (celsius). Red circles are sea turtle plasma measurements from Stabenau 1993. Black line is alphaCO2 equation adapted from Heisler, 1986 and red line is alphaCO2 equation from Christmas and Bassingthwaighte, 2017.
Equations
The equations for this model may be viewed by running the JSim model applet and clicking on the Source tab at the bottom left of JSim's Run Time graphical user interface. The equations are written in JSim's Mathematical Modeling Language (MML). See the Introduction to MML and the MML Reference Manual. Additional documentation for MML can be found by using the search option at the Physiome home page.
- Download JSim model MML code (text):
- Download translated SBML version of model (if available):
- No SBML translation currently available.
- Information on SBML conversion in JSim
We welcome comments and feedback for this model. Please use the button below to send comments:
 Stabenau EK, Heming TA, SHORT COMMUNICATION: DETERMINATION OF THE CONSTANTS OF THE
 HENDERSON–HASSELBALCH EQUATION, alphaCO2 AND pKa, IN SEA TURTLE PLASMA, J. exp. Biol. 180,
 311-314 (1993)

 Christmas KM and Bassingthwaighte JB. Equations for O2 and CO2 solubilities in saline and plasma:
 Combining temperature and density dependences. J Appl Physiol Vol:122, no. 5, 1313-1320
 DOI: 10.1152/japplphysiol.01124.2016 2017.

 HEISLER, N. (1986). Buffering and transmembrane ion transfer processes. In Acid–Base Regulation
 in Animals (ed. N. Heisler), pp. 3–47. Amsterdam: Elsevier Science Publishers
Please cite https://www.imagwiki.nibib.nih.gov/physiome in any publication for which this software is used and send one reprint to the address given below:
The National Simulation Resource, Director J. B. Bassingthwaighte, Department of Bioengineering, University of Washington, Seattle WA 98195-5061.
Model development and archiving support at https://www.imagwiki.nibib.nih.gov/physiome provided by the following grants: NIH U01HL122199 Analyzing the Cardiac Power Grid, 09/15/2015 - 05/31/2020, NIH/NIBIB BE08407 Software Integration, JSim and SBW 6/1/09-5/31/13; NIH/NHLBI T15 HL88516-01 Modeling for Heart, Lung and Blood: From Cell to Organ, 4/1/07-3/31/11; NSF BES-0506477 Adaptive Multi-Scale Model Simulation, 8/15/05-7/31/08; NIH/NHLBI R01 HL073598 Core 3: 3D Imaging and Computer Modeling of the Respiratory Tract, 9/1/04-8/31/09; as well as prior support from NIH/NCRR P41 RR01243 Simulation Resource in Circulatory Mass Transport and Exchange, 12/1/1980-11/30/01 and NIH/NIBIB R01 EB001973 JSim: A Simulation Analysis Platform, 3/1/02-2/28/07.