
Here are some examples of current research done by BioMedical investigators using the I4 system. None of this research is in its final form, but should give the reader some feeling for the capabilities of the imaging system.
Automated myocardial LV ROI definition
Parametric Imaging
Tracking myocardial surface markers
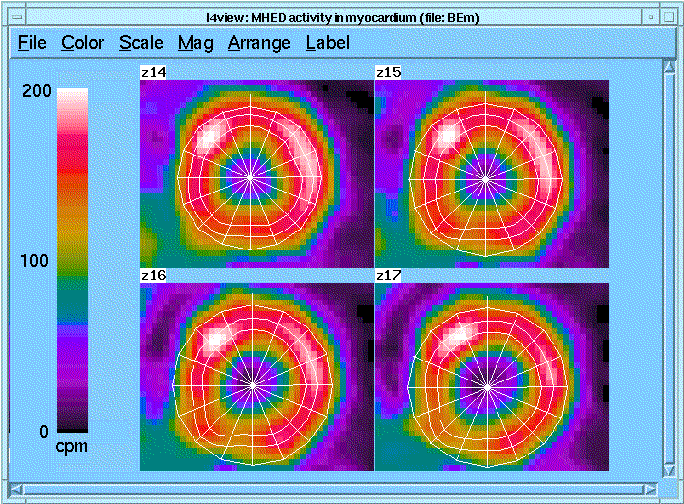
Automated myocardial LV ROI definition
Automated ROI definition eliminates subjective determi- nations by the investigator and reduces inter-study variabil- ity. LV ROI identification using I4 has three steps: (1) constructing a truncated "cone" through the center of the LV wall, (2) forming a "ring" on each z-plane that includes N pixels on either side of the mid-wall cone, and (3) dividing the rings into M sectors using a radial grid centered on the center of the ring. Illustrated are the I4-determined ROIs from a set of PET images of integrated activity over 15 min beginning 45 min after injection of 11C-MHED in a patient with a myocardial infarction. The image set contained 30 z- planes. ROI width (N) is 2 pixels and there are 16 (M) radial segments. While only planes 14-17 are shown, the ROIs actually spanned planes 7-28 (total of 352 ROIs).
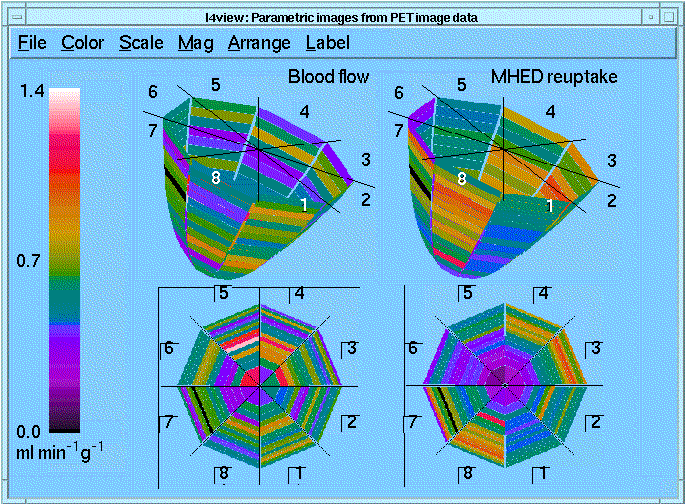
Parametric imaging
Using I4, time-activity curves can be extracted from mul- tiple ROIs, export the curves to XSIM for parametric analy- sis, and display the results as parametric images. The illustration shows the results of a PET study on a normal subject. LV ROIs were defined automatically using I4. Blood flow was determined using 15O-water and a Kety- Schmidt model. MHED reuptake, an indicator of myocar- dial sympathetic nerve activity, was calculated using an axi- ally distributed, multi-pathway organ model that with non- linear membrane transport and metabolic reactions (GEN- TEX). The 128 ROIs in the images were analyzed in parallel using the multiprocessing capabilities of XSIM. For the study shown, a six processor IBM SP/2 was used for the analysis.
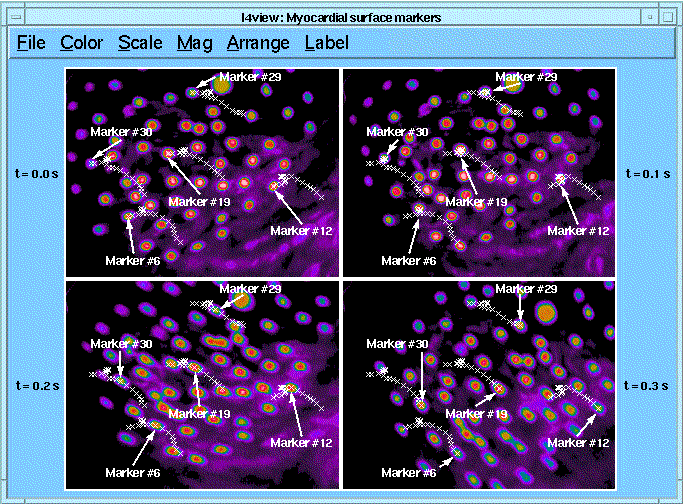
Tracking myocardial surface markers
The goal of the experiment is to measure local myocardial strain. 1mm diameter markers were placed on the anterior left ventricular surface near the origin of the LAD of the myocardium of an open-chest dog. Markers were imaged with a digital camera and frame grabber. 20 images were obtained over a period of 316 ms spanning about 1/3 of a cardiac cycle beginning with the opening of the aortic valve. I4 was used to clip, unlace, and filter the images. I4 deter- mined the centers of the markers and created ROI files that contain (1) the marker centers in each of the images and (2) tracks of the center of each marker in all images (shown in the figure). From the tracks, the distances between each marker and its neighbors can be calculated. Currently, no correction is made for curvature of the myocardial surface
Return to the I4 System Home Page.
Copyright ©: 1998 National Simulation Resource, University of Washington, Seattle, WA 98195-7962.
Last modified: 14:13:36, 04/13/98 (v. 1.1)
Model development and archiving support at https://www.imagwiki.nibib.nih.gov/physiome provided by the following grants: NIH U01HL122199 Analyzing the Cardiac Power Grid, 09/15/2015 - 05/31/2020, NIH/NIBIB BE08407 Software Integration, JSim and SBW 6/1/09-5/31/13; NIH/NHLBI T15 HL88516-01 Modeling for Heart, Lung and Blood: From Cell to Organ, 4/1/07-3/31/11; NSF BES-0506477 Adaptive Multi-Scale Model Simulation, 8/15/05-7/31/08; NIH/NHLBI R01 HL073598 Core 3: 3D Imaging and Computer Modeling of the Respiratory Tract, 9/1/04-8/31/09; as well as prior support from NIH/NCRR P41 RR01243 Simulation Resource in Circulatory Mass Transport and Exchange, 12/1/1980-11/30/01 and NIH/NIBIB R01 EB001973 JSim: A Simulation Analysis Platform, 3/1/02-2/28/07.