
1. TABLE OF CONTENTS
Model demonstrations with parameter sets
2. IMPORTANT !!! To run a demonstration, enter "xhost +nsr.bioeng.washington.edu" in one of your windows to allow the demonstration program to open windows on your machine !!!
3. Parameters
ENZMEM is parameterized as follows.
Table 1. ENZMEM Parameters
Access to all input variables is via clicking the "INPUT" button on the main model page or by selecting "Inputs" under the "Parameters" menu.
4. Output Variables
Output variables are given by:
Table 2. ENZMEM Output Variables
To plot results, select "Plot Area 1" from the Results menu. Place the cursor in an unused box under Y-parameters and press the right mouse button to bring up a list of plottable parameters.
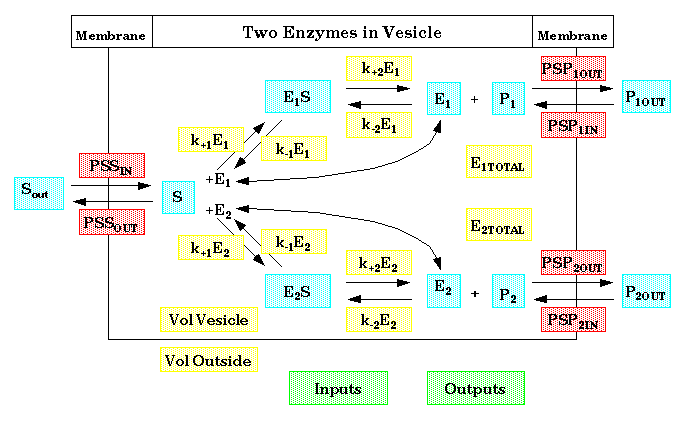
5. Diagram
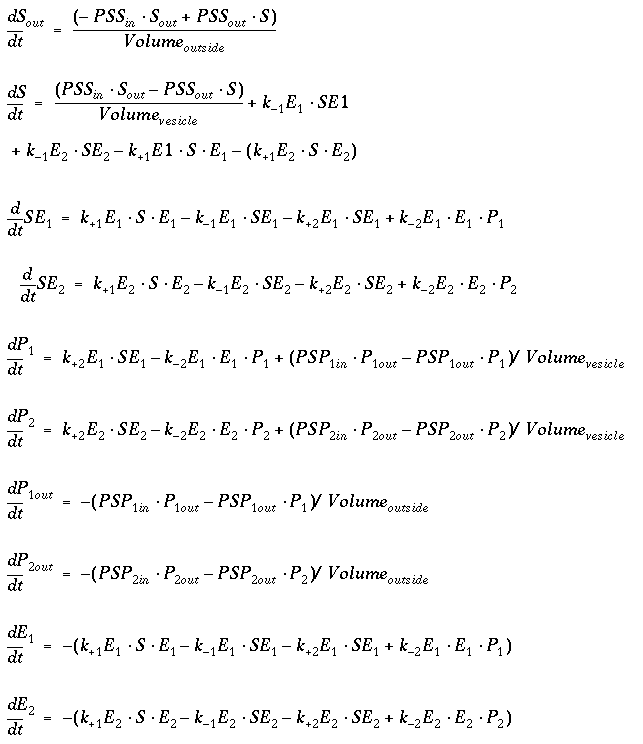
6. Equations
7. Model demonstrations with parameter sets
The user should inspect the input parameters and the output curves. Output curves can be found under the Results button under Plot Area 1 and Plot Area 2.
The following parameter sets are can be demonstrated by clicking on them:
7.1. Figure 2, Panels 1 and 2 : Figure2.panel_1_2.par
Run the model. The time dependent model shows curves which reflect the algebraic curves. Under Results, Plot Area 1 shows curves which reflect Panel 1, and Plot Area 2 reflect Panel 2. Note that only partial curves are calculated as the full range of the algebraic parameter space is not reflected in the time-dependent solutions.
7.2. Figure 2, Panels 1 and 3: Figure2.panel_1_3.par
Run the model. The time dependent model shows curves which reflect the algebraic curves. Under Results, Plot Area 1 shows curves which reflect Panel 1, and Plot Area 2 reflect Panel 3. Note that only partial curves are calculated as the full range of the algebraic parameter space is not reflected in the time-dependent solutions.
7.3. Figure 3, Panels 1 and 2: Figure2.panel_1_2.par
Run the model. The time dependent model shows curves which reflect the algebraic curves. Under Results, Plot Area 1 shows curves which reflect Panel 1, and Plot Area 2 reflect Panel 2. Note that only partial curves are calculated as the full range of the algebraic parameter space is not reflected in the time-dependent solutions.
7.4. Figure 3, Panels 1 and 3: Figure3.panel_1_3.par
Run the model. The time dependent model shows curves which reflect the algebraic curves. Plot Area 1 shows curves which reflect Panel 1, and Plot Area 2 reflect Panel 3. Note that only partial curves are calculated as the full range of the algebraic parameter space is not reflected in the time-dependent solutions.
7.5. Rapid transport through membrane with single enzyme: progress.par
Run the model. Under Results, find Plot Area 1.
Copyright © 2000, National Simulation Resource, University of Washington.
Contact garyr@bioeng.washington.edu with comments, questions, or critiques.