
1. TABLE OF CONTENTS
Model demonstrations with parameter sets
2. IMPORTANT !!! To run a demonstration, enter "xhost +nsr.bioeng.washington.edu" in one of your windows to allow the demonstration program to open windows on your machine !!!
3. Reference
Hodgkin, A.L. and Huxley, A.F., "A quantitative description of membrane current and its application to conduction and excitation in nerve, J. Physiol. (1952) 117, 500-544.
4. Input parameters
HODHUX is parameterized as follows.
Table 1. HODHUX Input Parameters
|
Temperature, reaction rates triple for |
||

 is the capacity current
 (gbarK)
 is the ionic current
 (VK)
(VK) (gbarNa)
 is the ionic
 (VNa)
(VNa) (gbarl)
 leakage current carried by
 (Vl)
(Vl) (V0)
(V0) (Vrest)
Access to all input variables is via selecting "Inputs" under the "Parameters" menu.
5. Calculated Parameters
The following parameters are calculated from the Input parametersAccess to all Access to all calculated variables is via selecting "Calculated" under the "Parameters" menu.
Table 2.
|
reaction speed of the alpha and beta constants which it multiplies. At 16.3 degrees centigrade, the rate |
||
 (phi)
(phi) controls the
 (n0rest)
 (m0rest)
 (h0rest)
6. Output Variables
Output variables are given by:
Table 3. HODHUX Output Variables


 (alphan)
 (betan)
 (alpham)
 (betam)
 (alphah)
 (betah)
 (IK)
(IK) (INa)
(INa) (Il)
(Il) (gK)
(gK)
 (gNa)
(gNa)
To plot results, select "Plot Area 1" from the Results menu. Place the cursor in an unused box under Y-parameters and press the right mouse button to bring up a list of plottable variables.
7. Diagram
8. Equations and Descriptions
The five governing equations are
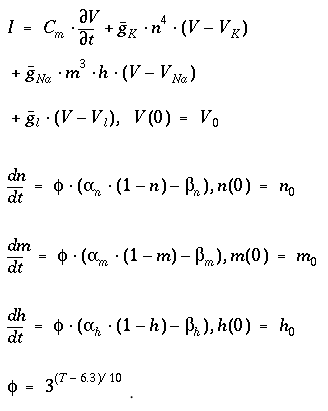
The equations for an, bn, am, bm, ah, and bh are given in the reference on page 519 as:
Note that an and am are undefined for V=-10 and -25, respectively, but are continuous functions when the limiting values are taken for those values.
The Initial condition for n is given in the resting state, defined by V=0 , in the model, Vrest , as  . Initial conditions for m and h are similarly defined. Depolarization means a negative voltage. The temperature dependence of the model is embodied in the parameter
  , which triples the rate constants for every increase of 10oC.
9. Model demonstrations with parameter sets
The user should inspect the input parameters and the output curves. Output curves can be found under the Results button under Plot Area 1 and Plot Area 2.
The following parameter sets are can be demonstrated by clicking on them:
9.1. Figure 12 : hodhux.FIG12.xsim.par
Run the model. Under Results, display Plot Area 1. This parameter sets reproduces Figure 12 from the reference.
9.2. Fluctuating output: hodhux.fluctuating.par
Run the model. Under Results, display Plot Area 1. This parameter set reproduces a fluctuation membrane potential.
Copyright © 2000, National Simulation Resource, University of Washington.
Contact garyr@bioeng.washington.edu with comments, questions, or critiques.