1. Introduction
The purpose of this document is to give XSIM users a jumpstart. It is presented as a series of events for typical simulation runs, parameter estimation by curve fitting, and advanced simulation and analysis using tools such as sensitivity analysis. Users should refer to the XSIM Interface and Reference manuals for details of XSIM functionalities.
The following streaming video clips (ASF - Advanced Stream Format) are provided for people who want to take a preview of XSIM but don't have a machine running X-server:
2. Model Simulation Run
2.1. Start XSIM
If you have XSIM installed on your local machine, you can also follow the tour by starting XSIM from command line "xsim".
2.2. XSIM Main Window
XSIM's main window is divided into three sections. At the top are the XSIM menus: Model, Par-File, Reference, Parameters, Results , and Help . Right now, the Parameters menu title is shown in gray. That indicates that the menu is not currently accessible. When we load a model, the menu will become accessible and its title will turn black.
Below the menus are the function buttons. None of the functions are accessible now since no model is loaded. This line also shows the interface status on the left, Idle right now, and the paste value on the right, none right now. You'll heare more about the status and paste value as you work through the sessions of the tour.
Below the buttons is the diagnostic message area. XSIM writes messages here that tell you about its operation and warn you of problems. Error messages from the model are also written here. Notice the scroll bars. You can scroll back to review old messages, or scroll left and right to view long messages.
2.3. Load a Model
To load a model, select the Model select option from the Model menu. This opens a dialogue box in which the name of the model can be entered. After the model name is entered, click the Load button to load the model. For the tour, we will load a model named btex20 . It is a simple blood-tissue exchange model consisting of a single capillary-tissue unit with two regions and one barrier unit. (You can also load a model when you start XSIM by including its name on the command line, i.e., "xsim btex20".)
Now that the demo model is loaded, the parameters menu is accessible, and its title switches from gray to black. Also, a new window titled BTEX20 main window is displayed. The contents of this window are not set by XSIM, but are determined by the model configuration file when the model was loaded.
The use of configuration files is a powerful feature of XSIM. These text files allow you to specify the contents and appearance of model-specific window(s) without knowing anything about programming the window system. To learn more about configuration files, read the Configuration File Reference Manual and Guide .
The btex20 configuration file has specified that the model window contains a model diagram with model parameter buttons. The model btex20 is parameterized as follows:
User-Defined Inputs
Calculated Model Outputs
2.4. Set Independent Variable
To set values of the independent variable, select the time parameter group from the parameters menu. The independent variable parameter group shows the name of independent variable and the current values of its starting and stopping values and its increment.
Note that the name, time , is not set by XSIM but by the configuration file when the model was loaded. Similarly, the initial start, stop, and increment values were set by the configuration file. New start, stop, or increment values can be entered by selecting the appropriate text field and typing a new value.
Now change the stopping time from 20 to 30 seconds.
2.5. Start Simulation Run
With a model loaded and the independent variable set, the model can now be run by clicking the run button. The values of the input parameters that are shown in the model window will be used for the simulation.
When the model run is started, the second line of the XSIM main window is redrawn. The status indicator changes from idle to running and new function buttons appear. The cancel button cancels the run and returns XSIM to idle state. The pause button causes the run to be paused at its current state. When the pause button is clicked, its title changes to resume so the the run can be resumed when desired. The horizontal bar graph at the right shows the fraction of the simulation run that has been completed. When the run is completed, the status returns to idle and the function buttons revert to the main XSIM functions.
2.6. Display Results
Let's look at plotting the results of this simulation run. XSIM has two plotting windows, plot area 1 and plot area 2 , that are accessible through the results menu.
Now open plot area 1. The plot window allows you to plot both simulation results and curves from the reference data file, if one has been loaded. You can control: which results are plotted, the parameter used as the independent variable, scaling of the X- and Y-axes, the color and size of the symbol(s) used for the curve(s), and the reference data curve(s) plotted. You also have access to a tabular listing of all values plotted. Since no parameters have yet been selected for plotting, No curves are shown, and the axes have defaults scaling of 0 - 1.
Let's plot the input function, Cin, which is set by the user; and the output function, Cout, which is calculated using the user-defined model parameters. The input curve is plotted by entering its name, Cin , in the y parameter text field. This has several results: the Cin curve is plotted, a label showing the parameter name and symbol used appears above the Y-axis (XSIM uses open symbols for simulation results and filled symbols for reference data), the X- and Y-axes are autoscaled to accommodate the data, and a new y parameter text field is opened so that another parameter name can be entered. Now enter Cout in the new y parameter text field.
Notice that no name has been entered for the X-axis parameter. By default, XSIM uses the independent variable. That's why its name, time , is already shown below the X-axis. You didn't get to select the symbol or color that was used for the curve. Right now, XSIM picks the symbol, its color (black), and size (medium). The color and size can be changed by selecting the curve (clicking on the name in the Y-parameter text field) and clicking the desired color and size button above the right side of the graph.
A final issue, how do you know what name to enter? One way is to look at the main group window to see the names of the outputs. That's easy in a simple model like this, but in a complex model with numerous windows it can be difficult to find the right group window. An alternate approach is to put the pointer in the Y-parameter text field and click the right mouse button. That pops up a new window (called a pick control window) that shows the the names of all the output parameters. Clicking on one of the names pastes the name into the text field. You can plot also input variables, but you have to type in its name. The pick control box won't show it.
Note: Using the right mouse button to pop up a pick control window is a general mechanism that works almost any place that a parameter or curve name is required.
When the model is run with the plot window open and a curve selected for display, the data are displayed point-by-point as the model runs. Let's run the model again with the plot window open.
In addition to plotting input and output parameters, you can also plot a mathematical expression that is a function of constants and model parameters. As an example, let's plot Cout-Cin as a function of time. Note that the model doesn't have to be rerun to get the results of Cout-Cin .
In addition to the arithmetic operators of +, -, *, /, and ** (exponentiation), a number of mathematical functions can be used including trigonometric functions and logs. For a complete list of the functions available, read the XSIM Expression Evaluator in the appendices of the XSIM documentation package .
2.7. Change Model Parameter Values
You can change the model parameter values on the BTEX20 main window . Now click on the Fp button from 1.0 to 2.0 and run the model again.
2.8. Change Plot Scales
By default, the plot axes are autoscaled to match the range of the data. You can however, select manual scaling on either axis by clicking on the X auto and/or Y auto buttons. When manual scaling is selected, the axis minumum and maximum are displayed. You may need to reposition the plot window to see the Y-axis limits on the far right of the window. The current limits are those set when the axis was autoscaled to fit the data during the last simulation run.
An axis can be rescaled by typing a new value into the appropriate limit text field. Let's reset the Y-axis limits to 0.0 and 0.15 to have a better look at the Cout curve. Note that when manual scaling is used, any data that fall outside the axis limits are not plotted (See Cin curve as such an example).
Either linear or logarithmic scaling can be selected for the axes. Linear scaling is used by default. You can change to log scaling by clicking the linear button for the appropriate axis.
The Y-axis is now scaled logarithmically. This is possible even though the data contained negative and zero values. XSIM ignores any data values that are equal to or less than zero when log scaling is requested.
Note that the Y-axis log button is shown in reverse video. This indicates that the log scaling is in effect. If you were using manual scaling and had specified a minimum of zero or less, XSIM would be unable to honor the log scaling request, and the log button would remain in normal video.
2.9. Change Plot Colors
Now let's first return to the default condition: automatic, linear scaling on both axes. The curve has been plotted with the default symbol color (black) and size (medium). These can be changed by selecting the curve (clicking on the text field that contains its name) and then clicking on the desired color and/or size box(es) to the right of the paste button. Let's change Cin to large, red symbols.
Note that while you can change the color and size of the symbols, you cannot select the symbol used.
2.10. View the Tabulated Results
You can view a report containing the numeric values of the functions plotted. The report contains all the numeric values of the curves in the plot window. In the listing you see, the left column is time, the center column is Cin , and the right column is Cout .
The report is written in TAC ( T ime- A ctivity- C urve) format, a locally-developed, self-documenting format for data files that is used by XSIM and other data analysis programs of the Simulation Resource. To move back to the head of the report by placing the pointer on the slider in the scroll bar on the right of the window, press the left mouse key, and drag the slider to the top of the scroll bar.
The tabulated results can be saved as a TAC file by clicking on the SAVE button in the Report window.
2.11. Save Current Settings to a Parameter File
By clicking on Par-File menu on the Main XSIM Window and choose Save or Save As , you can save the current settings to a parameter file, e.g., test1.par, for future use. The parameter file saves all the information that is needed for XSIM to pick up where you left. For example, you can start a XSIM session with the saved parameter file by typing "xsim test1.par" and XSIM will load the model btex20 and all the parameter values you have saved.
3. Parameter Estimation
3.1. Start XSIM
Read Section 2.1 for instructions.
3.2. Load Data File
Click on Reference menu on the Main XSIM Window and choose Select TAC File . A new window titled TAC File Select will pop up. A list of available TAC files in the current working directory will show under Files . For this tour, there is only one TAC file named noisybtex40.opt.tac so choose it by clicking on the file name and then click OK .
3.3. Display Data Curves
Click on Results menu on the Main XSIM Window and choose Plot Area 1 . In the Reference text box in the Plot window, right click and a pick window will pop up. Choose the curve R1s1 . Note that there can be multiple curves in the data file.
3.4. Parameter Estimation by Curve Fitting
First you need to know which model solution to be be fitted to which data curve. In this case, it is Cout to be fitted to R1s1.
Secondly, you need to know what model parameters need to be adjusted in order to fit the data, In this case, they are Fp, PScap and V'isf .
Now we can configure a optimization run to fit the data curve. Click on Model menu on the Main XSIM Window and choose Optimize Config... A new window titled Optimization_Config should pop up. There are three areas in the window: Optimization Control where you can choose the optimizer ( sensop or simplex ) and stopping criteria; Parameters to vary where you can choose parameter names ( Fp, PScap and V'isf for this case), minimal vaules, maximal values and current (or initial) values; and Reference TACs to match where you can choose the data curve name (under TAC ), the model solution name (under Par/Expr ), the weighting function for each point in one curve and the weighting function for each curve. Now enter the values shown in the follwoing graph:
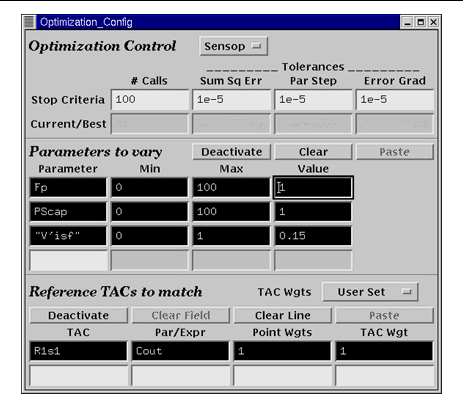
Now click on Run button and observe the model solution Cout with the current model parameter values. Click on Optimize button to start the curve fitting. After the optimization is completed, run the model again and observe the model solution Cout compared to R1s1 . You can see the fit is much improved.
3.5. Residual Function
Click on Results menu on the Main XSIM Window and choose Residuals . After the calculation of the Residual function which is the difference between the model solution and data curve, click on Results menu on the Main XSIM Window and choose Residual Graph .
Note that there will always be systemic misfit for this example because the simulated data curve was generated by a 4-region model.
3.6. Report of the Optimization Run
Click on Results menu on the Main XSIM Window and choose Optimization Report.
4. Advanced Simulation and Analysis
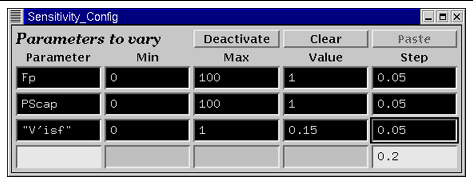
4.1. Sensitivity Analysis
Click on Model menu on the Main XSIM Window and choose sensitivitY config... A new window titled Sensitivity_Config should pop up and you can choose the parameters for the analysis. Note that the sensitivity functions are dependent on the parameter values and fractional step sizes.
Enter the following sensitivity configuration and click on the Sensitivity button on the Main XSIM Window . After the calculation is completed, click on Results menu on the Main XSIM Window and choose Sensitivity Graph to view the results.
4.2. Simulation Run Configuration
Another way to examine the sensitivity of model parameters to model solutions is to do simulation runs on a loop using different parameter values for each run. XSIM allows two loops and you can click on Model menu on the Main XSIM Window and choose Run config... A new window titled Run_Config will pop up and you can enter the following run configuration. Click on the Run button on the Main XSIM Window and view the model solution Cout changing on each run in the plot window.
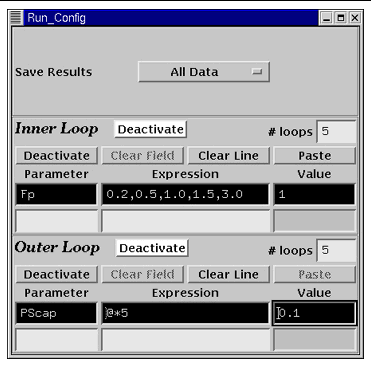
Note that you can either enter a list of parameter values for the loop (See Fp in this case) or using expression (See PScap in this case). The expression "@*5" in this case means the value of PScap increases five-fold for every simulation run.
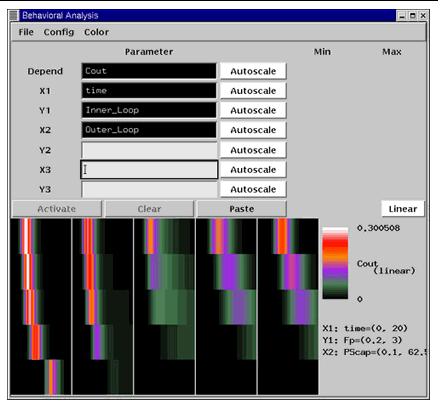
4.3. Behavioral Analysis
This is a visualization method to examine the results of looped simulation runs. Click on Results menu on the Main XSIM Window and choose Behavioral Analysis. A new window titled Behavioral Analysis will pop up and you can enter the following configuration. With the run configuration used in the last section, Y1 axis represents different values of Fp ( Inner_Loop ) and X2 axis represents different values of PScap ( Outer_Loop ). The lower half of the window shows the image of the Behavioral Analysis results. The image consists of a matrix of 5x5 small images. Within each small image, the X axis is X1 ( time ) and the color scale represents the value of the model solution Cout . For the matrix, the X axis is X2 ( Outer_Loop or PScap ) and the Y axis is Y1 ( Inner_Loop or Fp ). This analysis provides an overview of how model parameters affect the model solution. In this case, Cout is a tight bolus when Fp is high and PScap is low. This is a nice illustration of the relationship of flow vs. transmembrane transport.