
Washout curve simulation by sum of three decaying exponentials: analysis using two or three exponentials.
Description
   Typical washout curves of solutes injected into an
 organ or into the body can be decomposed into sums of
 exponentially decaying functions, e.g.

        C = C10*exp(-k1*t) + C20*exp(-k2*t) + C30*exp(-k3*t).

 A set of noiseless data obtained from exact solutions is called EXPdecay.
 It includes 5 representation of a solution, rounded off to 6, 4, 3, 2,
 and 1 digit, to test the influence of accuracy on the parameter estimation.
 See notes page of project file for more information.

 Other such data sets, with and without added noise, and of different
 duration can be tested.

 The format of the .cdata file uses the first line for the data titles,
 enclosed in double quotes separated by tabs or spaces. A second line
 (optional) may contain the data units in double quotes separated by tabs
 or spaces. Subsequent lines contain the data separated by tabs or spaces.
 There must be at least two columns. The first column is the independent
 variable and must be in ascending sequence.

EXPdecay.cdata file :
"time"  "C_del_2_6"     "C_del_2_4"     "C_del_2_3"     "C_del_2_2"     "C_del_2 _1"
"sec"   "mM"    "mM"    "mM"    "mM"    "mM"
0       1       1       1       1       1
2       .453386 .4534   .453    .45     .5
4       .314385 .3144   .314    .31     .3
6       .248923 .2489   .249    .25     .2
8       .205966 .206    .206    .21     .2
10      .174064 .1341   .134    .13     .1
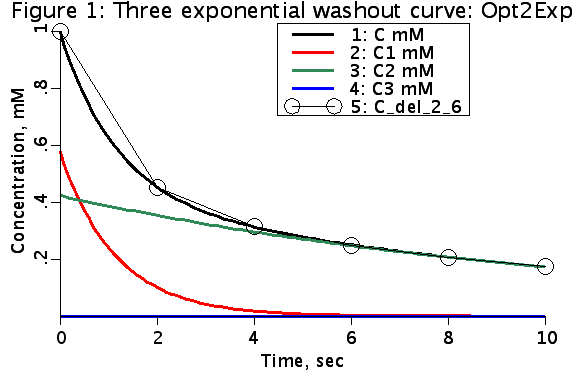
Figure: Fit of sum of two exponentials to simulated washout data. C1 and C2 are the two exponentially decaying curves. Circles (C_del_2_6) are plots of the simulated data using sum of three exponentially decaying curves.
Equations
The equations for this model may be viewed by running the JSim model applet and clicking on the Source tab at the bottom left of JSim's Run Time graphical user interface. The equations are written in JSim's Mathematical Modeling Language (MML). See the Introduction to MML and the MML Reference Manual. Additional documentation for MML can be found by using the search option at the Physiome home page.
- Download JSim model MML code (text):
- Download translated SBML version of model (if available):
We welcome comments and feedback for this model. Please use the button below to send comments:
None.
Please cite https://www.imagwiki.nibib.nih.gov/physiome in any publication for which this software is used and send one reprint to the address given below:
The National Simulation Resource, Director J. B. Bassingthwaighte, Department of Bioengineering, University of Washington, Seattle WA 98195-5061.
Model development and archiving support at https://www.imagwiki.nibib.nih.gov/physiome provided by the following grants: NIH U01HL122199 Analyzing the Cardiac Power Grid, 09/15/2015 - 05/31/2020, NIH/NIBIB BE08407 Software Integration, JSim and SBW 6/1/09-5/31/13; NIH/NHLBI T15 HL88516-01 Modeling for Heart, Lung and Blood: From Cell to Organ, 4/1/07-3/31/11; NSF BES-0506477 Adaptive Multi-Scale Model Simulation, 8/15/05-7/31/08; NIH/NHLBI R01 HL073598 Core 3: 3D Imaging and Computer Modeling of the Respiratory Tract, 9/1/04-8/31/09; as well as prior support from NIH/NCRR P41 RR01243 Simulation Resource in Circulatory Mass Transport and Exchange, 12/1/1980-11/30/01 and NIH/NIBIB R01 EB001973 JSim: A Simulation Analysis Platform, 3/1/02-2/28/07.