
Uncontrolled CV loop pressure-flow model ported from Rideout (ACSL program PF-0). Also in MATLAB.
Further reading: Rideout's section 4.3, pages 90-97.
Description
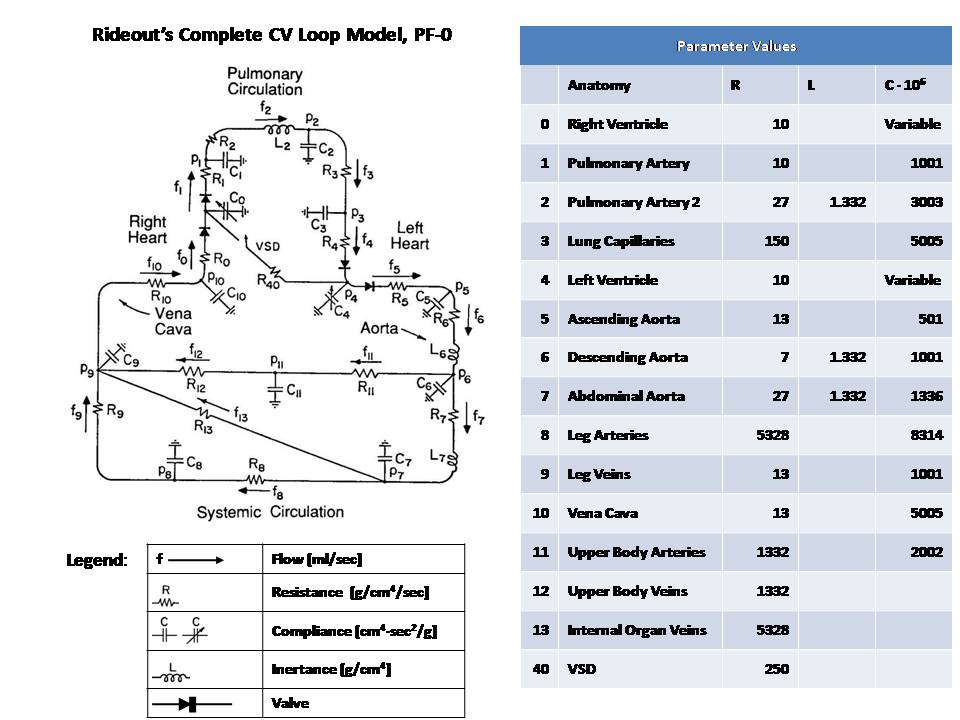
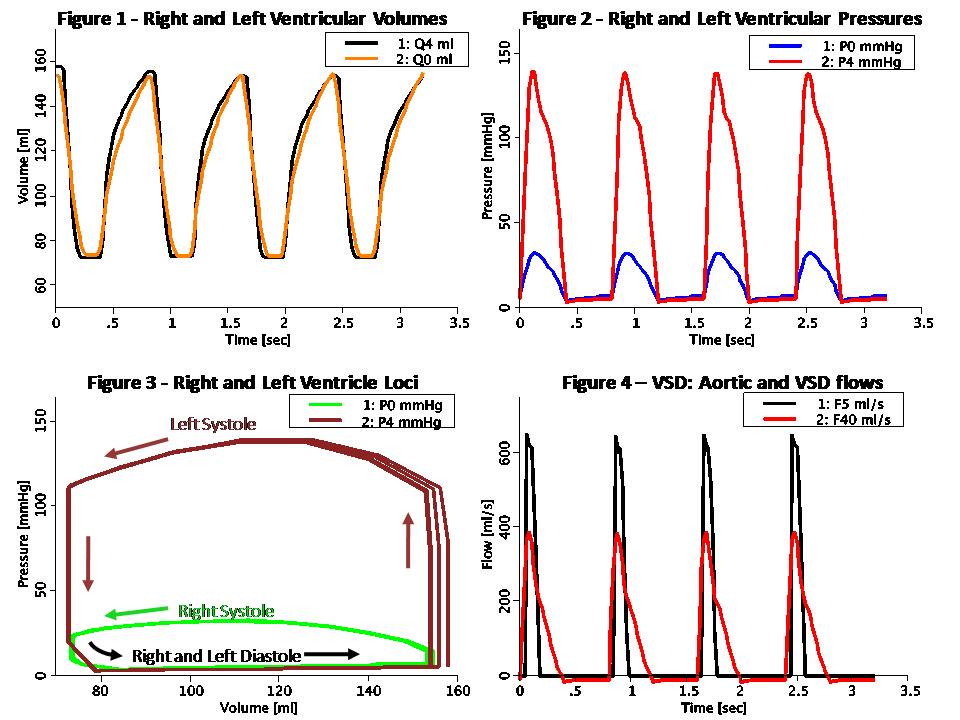
This model simulates the complete CV loop using Pressure-Flow modeling.
The model is uncontrolled, i.e. does not include baroreceptor sensor
connections to the central nervous system (CNS). Also, it does not
consider blood diffusion from and to tissue. The model takes advantage
of the analogy to RLC circuits as shown below:

Pressure-Flow-Volume             Electrical Circuit Equivalent
------------------------------------------------------------------
F  Flow (ml/s)                   I  Current (Amper)
P  Pressure (mmHg or g/cm/s^2)   V  Voltage (Volt)
Q  Volume (ml)                   Q  Charge (Coulomb or Amper*s)
R  Resistance (g/cm^4/s)         R  Resistance (Ohm or Volt/Amper)
C  Compliance (cm^4*s^2/g)       C  Capacitance (Farad or s/Ohm)
L  Inertance (g/cm^4)            L  Inductance (Henry or s*Ohm)

Pressure-Flow components obey the same fundamental equations as
their RLC circuit equivalents, i.e.:

P = R * F                        V = R * I    (Eq. 1 or Ohm's Law)
P = L * F:t                      V = L * I:t  (Eq. 2)
P = Q / C                        V = Q / C    (Eq. 3)
F = Q:t                          I = Q:t      (Eq. 4)

The right and left heart pathways are modeled with an RLC circuit
similar to that used in Rideout's left heart model LH-PF-2 mode, ported
to JSim in model Rideout_PressureFlowLH. Alternatively, this model may
be described as a compartmental representation of mass-transport, where
each of the 12 compliances in the RLC circuit, corresponds to a perfect
mixing chamber.

Circuit segment 0 corresponds to the right ventricle. Segments 1, 2 and
3 represent the pulmonary circulation. Segment 4 corresponds to the left
ventricle. Oxygenated blood leaves the left ventricle and flows through
ascending aorta (segment 5) and descending aorta (segment 6). There are
two major arterial systemic paths: segment 7, which represent the
abdominal aorta and segment 11, which represents the upper body arteries
(fed through the common carotid). The abdominal aorta bifurcates into
the common iliac arteries which feed internal organs and leg arteries
(segment 8). The systemic venous system returns deoxygenated blood from
the legs (segment 9), upper body (segment 12) and internal organs
(segment 13). These veins drain into the vena cava (segment 10) and
empty into the right atrium.

Unlike Rideout_PressureFlowLH, this model has no fixed potentials
(pressures). Both the left and right ventricles have time-varying
compliance or stiffness (S = 1 / C). The actuating signals are periodic
half-sines S0 and S4 for the right and left ventricles stiffness
respectively. Systole and diastole durations are both 0.4 sec, so that
heart pulse is 0.8 sec (corresponding to 75 beats/min heart pulse). Peak
systolic stiffness is chosen such that it is approximately four times
larger in the left heart than in the right heart. Valves are simulated
using flow limiters.

This model may be used to study the effect of Ventricular Septal Defect
(VSD). This is done with an optional resistive shunt flow represented by
R40 = 1 / GD, where GD is the VSD conductance. When GD is zero, R40 is
infinite and there is no VSD flow.

Initial conditions in this model were chosen based on the steady state
at the end of diastole. Note that these values are slightly different
than the ones used in Rideout's ACSL program.

Figure 1 shows the left and right ventricular volumes, Q4 and Q0. As
seen, the stroke volume pumped out of each ventricle is approximately
90 ml. At a heart pulse of 0.8 sec, this corresponds to a cardiac
output of 112 ml/sec (6.7 liter/min). End-systolic volume (ESV) and
end-diastolic volume (EDV) are similar in each ventricle, around 160 ml.
This means that the ejection fraction (EDV - ESV) / EDV is 56%.

Figure 2 shows the right and left ventricular pressures, P0 and P4. As
seen, peak pressure is about four times larger in the left ventricle.

Figure 3 shows the loci on the Pressure-Volume plane of the right and
left ventricles. Each systole-diastole cycle corresponds to one full
counterclockwise traversal of the loci.

Figure 4 shows the effect of introducing VSD flow. In this case, the
area under the aortic flow and VSD shunt flow are approximately the
same. Thus, about half of the left ventricle output is returned to
the right ventricle through the defect.
Equations
The equations for this model may be viewed by running the JSim model applet and clicking on the Source tab at the bottom left of JSim's Run Time graphical user interface. The equations are written in JSim's Mathematical Modeling Language (MML). See the Introduction to MML and the MML Reference Manual. Additional documentation for MML can be found by using the search option at the Physiome home page.
- Download JSim model MML code (text):
- Download translated SBML version of model (if available):
Download MATLAB model M-File
We welcome comments and feedback for this model. Please use the button below to send comments:
Rideout VC. Mathematical computer modeling of physiological systems.
Prentice Hall, Englewood Cliffs, NJ, 1991, Section 4.3, pp. 90-105

Rideout VC. Cardiovascular System Simulation in Biomedical Engineering
Education. IEEE Trans. Biomed. Eng., Vol. BME-21, 1972, pp. 101-107
Please cite https://www.imagwiki.nibib.nih.gov/physiome in any publication for which this software is used and send one reprint to the address given below:
The National Simulation Resource, Director J. B. Bassingthwaighte, Department of Bioengineering, University of Washington, Seattle WA 98195-5061.
Model development and archiving support at https://www.imagwiki.nibib.nih.gov/physiome provided by the following grants: NIH U01HL122199 Analyzing the Cardiac Power Grid, 09/15/2015 - 05/31/2020, NIH/NIBIB BE08407 Software Integration, JSim and SBW 6/1/09-5/31/13; NIH/NHLBI T15 HL88516-01 Modeling for Heart, Lung and Blood: From Cell to Organ, 4/1/07-3/31/11; NSF BES-0506477 Adaptive Multi-Scale Model Simulation, 8/15/05-7/31/08; NIH/NHLBI R01 HL073598 Core 3: 3D Imaging and Computer Modeling of the Respiratory Tract, 9/1/04-8/31/09; as well as prior support from NIH/NCRR P41 RR01243 Simulation Resource in Circulatory Mass Transport and Exchange, 12/1/1980-11/30/01 and NIH/NIBIB R01 EB001973 JSim: A Simulation Analysis Platform, 3/1/02-2/28/07.