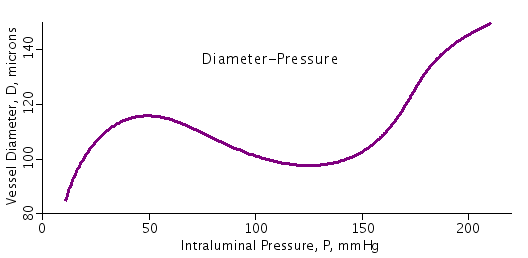
This model describes how a microvessel responds to changes in intraluminal pressure in the steady state. This change in vessel diameter to pressure is known as the myogenic response.
Description
  This model describes how a microvessel responds to changes in intraluminal
  pressure in the steady state.  This change in vessel diameter to pressure
  is known as the myogenic response.  This response is a local regulatory
  response and has been characterized in several experimental studies.  Other
  regulatory responses not included in this model are the shear, metabolic,
  neuronal and hormonal responses.  Regulatory microvessels are composed of
  an inner endothelial layer surrounded by circumferentially oriented
  vascular smooth muscle (VSM) cells and sheathed with a collagen sleeve.
  The VSM cells actively respond to the pressure difference across the vessel
  wall. The other components of the vessel wall act as a non-linear spring in
  parallel with this active component.  Therefore the stress in the vessel
  wall can be described as the stress in the passive elements of the the
  vessel wall added to the active VSM stress.  These two components must
  balance the circumferential stress generated by the pressure difference
  across the vessel wall.  So:

                         SigTot = SigPass + SigAct

  where SigTot is the pressure generated circumferential stress governed by
  the Law of Laplace:

                                      P * D
                          SigTot = -----------
                                    2 * tWall

  where P is the intraluminal pressure, D is the vessel diameter and tWall
  is the vessel wall thickness.  The passive stress is nonlinear with
  respect to D and has been approximated here with an exponential:

           SigPass = (Cp1/tWall) * exp ( Cp2 * (( D/Dp100 ) - 1) )

  where Cp1 is the passive tension at an intraluminal pressure of 100 mmHg,
  Cp2 describes the steepness of the exponential and Dp100 is the diameter
  of the vessel in a passive state at 100 mmHg.  The active stress can be
  further broken down into two components: Act, the degree of activation of
  the VSM (range from 0 to 1) and SigActMax, the active stress generated by
  the VSM in a maximally activated state.  The shape of the maximally active
  VSM stress curve as a function of diameter based on experimental findings
  has been found to be Gaussian in form and is given here by:

                                     _                        _
                                    |   _                 _ 2  |
                       Ca1          |  |  (D/Dp100) - Ca2  |   |
         SigActMax = ------- * exp < - | ----------------- |    >
                      tWall         |  |_       Ca3       _|   |
                                    |_                        _|

  where Ca1 is the peak active tension, Ca2 is the diameter of the peak
  active stress normalized by the passive vessel diameter at 100 mmHg,
  and Ca3 is the width of the Gaussian normalized by Dp100.  The VSM
  activation is approximated by a sigmoidal function and is given by:

          Act = 1 / ( 1 + exp ( -Cmyo*SigTot*tWall + Ctone ) )

  where Cmyo determines the sensitivity of the VSM activation to
  circumferential tension and Ctone is the base level of VSM tone that is
  in a vessel without these stimuli.  So now the circumferential stress
  in the vessel wall, SigTot, can be given by:

                   SigTot = SigPass + (Act * SigActMax)

  The vessel that is fit by the parameters used in this code is presented
  of mesenteric arterioles in Wister-Kyoto rats as presented in Figure 1 of
   a study by Bund (Clin Sci 101:385-393,2001).  Other data sets can be fit
  using different values of Cp1, Cp2, Ca1, Ca2, Ca3, Cmyo and Ctone.  This
  model was modified from the previously developed Regulatory_Vessel model
  which was formulated only in terms of vessel wall tension.

Figure: Relationship between pressure within the vessel (intraluminal) and vessel diameter.
Equations
The equations for this model may be viewed by running the JSim model applet and clicking on the Source tab at the bottom left of JSim's Run Time graphical user interface. The equations are written in JSim's Mathematical Modeling Language (MML). See the Introduction to MML and the MML Reference Manual. Additional documentation for MML can be found by using the search option at the Physiome home page.
- Download JSim model MML code (text):
- Download translated SBML version of model (if available):
We welcome comments and feedback for this model. Please use the button below to send comments:
   Carlson BE and Secomb TW. A theoretical model for the myogenic response based on the
   length-tension characteristics of vascular smooth muscle.  Microcirc 12:327-338, 2005.

   Bund SJ., Spontaneously hypertensive rat resistance artery structure
   related to myogenic and mechanical properites. Clinical Science 101:385-393, 2001.
Please cite https://www.imagwiki.nibib.nih.gov/physiome in any publication for which this software is used and send one reprint to the address given below:
The National Simulation Resource, Director J. B. Bassingthwaighte, Department of Bioengineering, University of Washington, Seattle WA 98195-5061.
Model development and archiving support at https://www.imagwiki.nibib.nih.gov/physiome provided by the following grants: NIH U01HL122199 Analyzing the Cardiac Power Grid, 09/15/2015 - 05/31/2020, NIH/NIBIB BE08407 Software Integration, JSim and SBW 6/1/09-5/31/13; NIH/NHLBI T15 HL88516-01 Modeling for Heart, Lung and Blood: From Cell to Organ, 4/1/07-3/31/11; NSF BES-0506477 Adaptive Multi-Scale Model Simulation, 8/15/05-7/31/08; NIH/NHLBI R01 HL073598 Core 3: 3D Imaging and Computer Modeling of the Respiratory Tract, 9/1/04-8/31/09; as well as prior support from NIH/NCRR P41 RR01243 Simulation Resource in Circulatory Mass Transport and Exchange, 12/1/1980-11/30/01 and NIH/NIBIB R01 EB001973 JSim: A Simulation Analysis Platform, 3/1/02-2/28/07.

