
Four region, recirculating model for the O2-CO2 transport, exchange and metabolism. Based on Dash 2006 paper. Computes dissolved O2 and CO2 from total O2 and CO2 (TO2 and TCO2) through numerical inversion method using SHbO2CO2_EJAP2016 routine and Christmas 2017 O2/CO2 solubility algorithm. Gas exchange with 3 comp lung is used. Incorporates Calculations for temperature changes based on consumption of O2 in parenchymal region.
Use of MPC to build this model.
Description
 Four region, recirculating model for the O2-CO2 transport, exchange and metabolism. Based on
 Dash et al 2006 and 2010 papers. Computes dissolved O2 and CO2 from total O2 and CO2 (TO2 and TCO2)
 through numerical inversion method using Dash et al. 2016 routine. O2 and CO2 gas solubility change with
 time and position based on Christmas et al. 2017 O2/CO2 solubility algorithm that incorporates temperature
 and density (or water space) into its solubility calculations. Gas exchange with simple 3 compartment
 lung is used. Incorporates calculations for temperature changes (time and position dependent) based on
 consumption of O2 generating heat in parenchymal tissue region and releasing heat through lung exchange.
Model layout
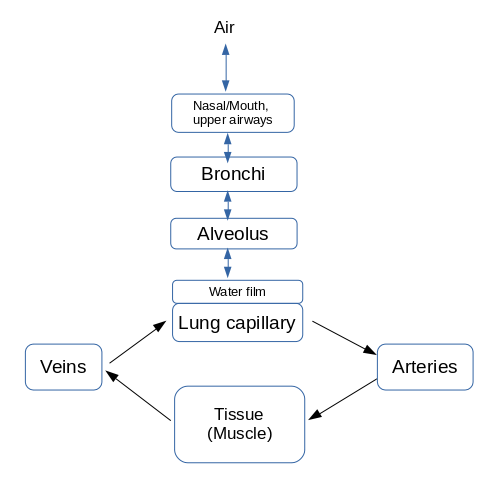
Figure 1: Layout of model and flow of gases (O2, CO2). Flow of gases in the lung is governed by ordinary differential equations (ODEs) with time domain (Air to Alveolus regions). The recirculating blood and tissue exchange equations are governed by partial differential equations (PDEs) with time and axial spatial domains (Lung capillary to Arteries to Tissue to Veins). See Figure 2 below for details of tissue-exchange. Lung capillary sub-region has just blood (RBC and plasma) with a water film region as the interface between it and the Alveolus. The Veins and Arteries just have the blood region (RBC and plasma).
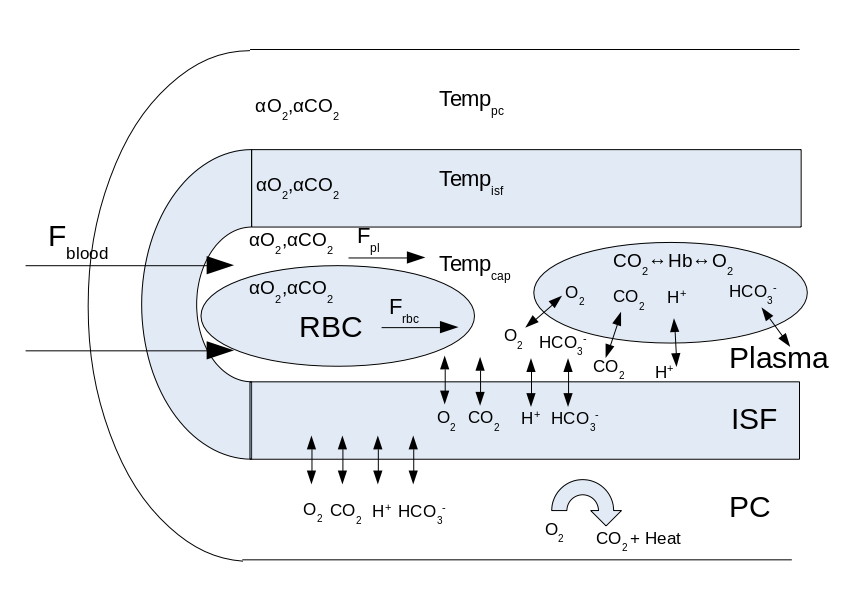
Figure 2: Muscle blood-tissue-exchange (BTEX) region. All four sub-regions: RBC, plasma, interstitial fluid (ISF), parenchymal cell (PC) have separate solubility coefficients for O2 and CO2 (αO2, αCO2), and separate O2, CO2, HCO3-, H+ concentrations. All variables have time and one spatial dimension along the axis of the capillary. The consumption of oxygen occurs in the PC which produces carbon dioxide and heat which raises the temperature in the PC. Temperature of RBC and plasma sub-regions are assumed to be the same. Blood flow (Fblood), RBC flow (Frbc), and plasma flow (Fpl) are different based on hematocrit and measured relative velocity differences between plasma and RBCs. Binding of O2 and CO2 to hemoglobin (Hb) occurs in the RBC and O2 to myoglobin occurs in the PC.
Model Simulation Plots
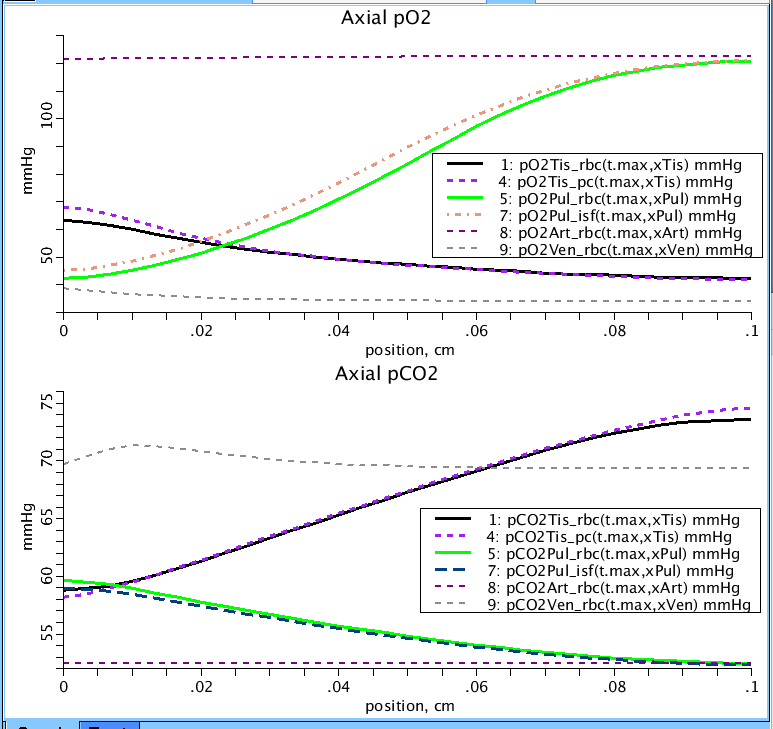
Figure 3: Axial profiles of the partial pressures of O2 and CO2 in the four regions of the model (tissue:Tis, lung:Pul, arteries:Art, veins:Ven). Three sub regions are pictured for clarity: RBC, PC, and in the lung, pO2Pul_isf and pCO2Pul_isf correspond to the partial pressures of O2 and CO2 in the thin water film sub-region. Plot occurs at end of simulation run at near steady-state. Note: consumption of O2 in the tissue as the partial pressure diminishes along the capillary while CO2 increases. For all plots: Initial pO2 in blood vessels = 70 mmHg, pCO2 = 60 mmHg, pO2 in isf and pc = 40 mmHg, CO2 in isf and pc = 60 mmHg. pH in the plasma = 7.4. Partial pressure of O2 in air = 150 mmHg, CO2 = 0 mmHg.
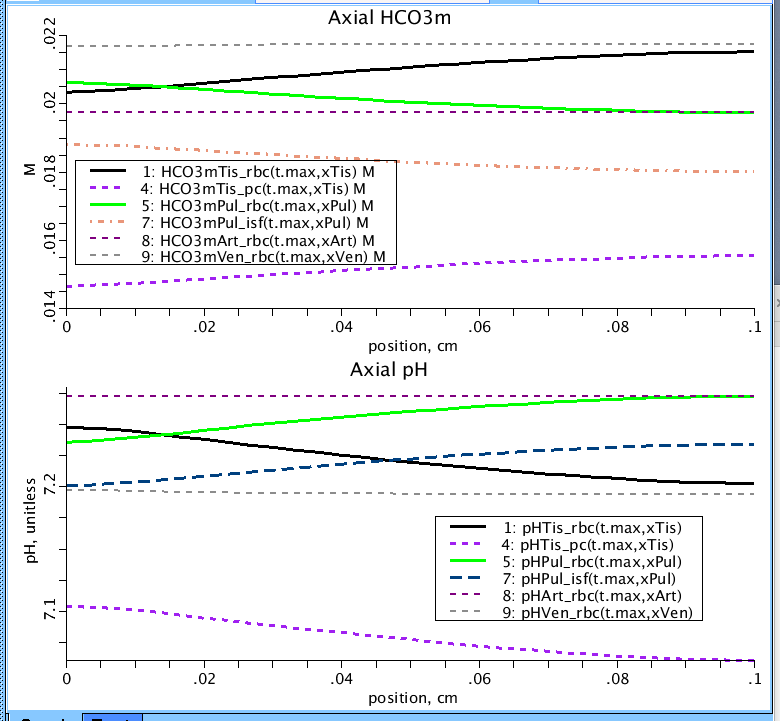
Figure 4: Axial profiles of the pH, and HCO3- concentrations in the four regions of the model (Tissue:Tis, Lung:Pul, Arteries:Art, Veins:Ven). Three sub regions are pictured for clarity: RBC, PC, and in the lung, pHPul_isf and HCO3mPul_isf correspond to the pH and bicarbonate concentration in the thin water film sub-region. Plot occurs at end of simulation run at near steady-state.
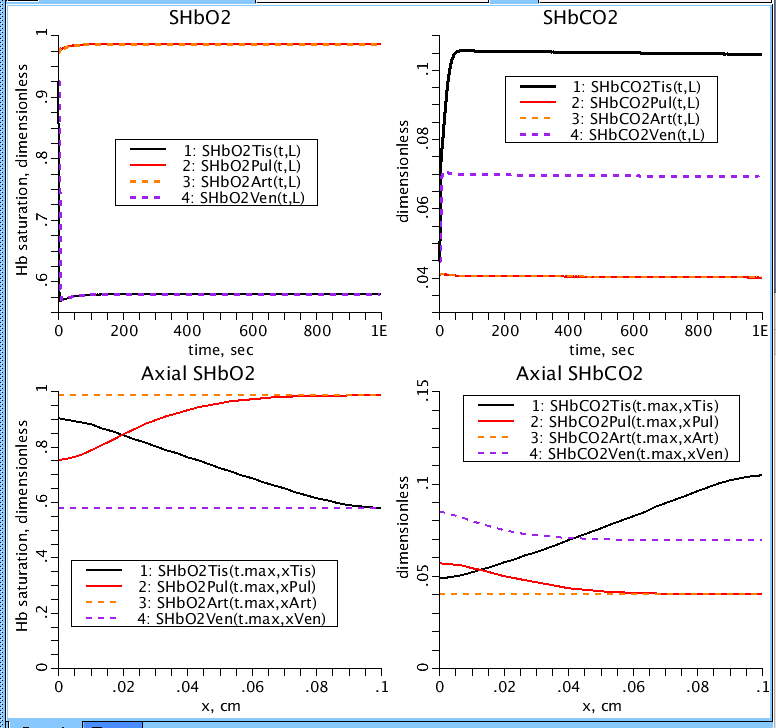
Figure 5: O2 and CO2 hemoglobin saturations in each of the four regions (SHbO2, SHbCO2). Top two plot Hb saturation as a function of time while the bottom plots Hb saturation as a function of distance along the capillaries.
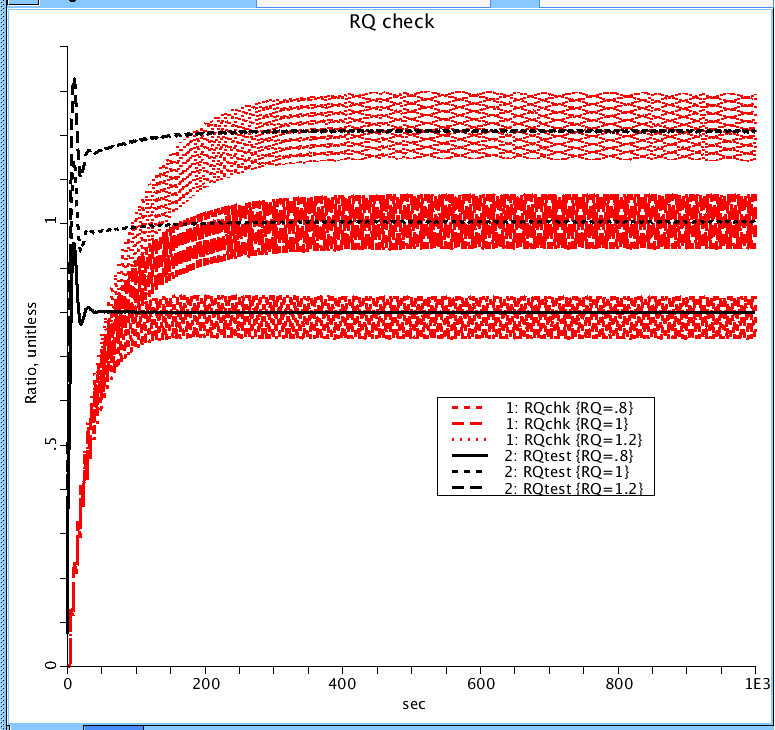
Figure 6: Compare ratio of CO2 produced over O2 consumed to confirm it matches the respiratory quotient (RQ). Measured two different ways: (blk) ratio of difference in CO2 amount entering and leaving tissue region (produced in the PC) over the amount of O2 entering and leaving the tissues region (consumed in the PC). (red) ratio of CO2 leaving the mouth over the amount of O2 consumed in the tissue PC. Since the simulation approximates breathing, CO2 is leaving and none entering there is an oscillation in the ratio but it should centered about the RQ. For an RQ of 0.8, 1.0, and 1.2, the average for the three are 0.79, 1.00, and 1.21 respectively They both should match the expected ratios of 0.8, 1.0, and 1.2 at steady-state.
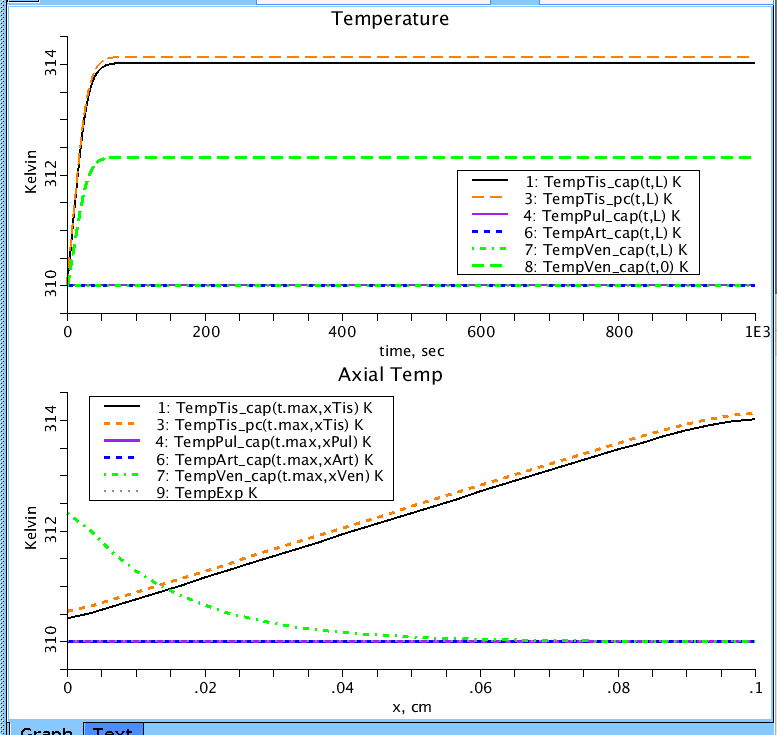
Figure 7: Temperature in the capillary of the four regions and in the tissue PC as a function of time (Top) and as a function of blood vessel position (Bottom). Heat is produced in the tissue region (TempTis_pc) and released through the veins (TempVen_cap) and lung (TempPul_cap). TempExp is the experimental temperature and is 310 K.
Equations
The equations for this model may be viewed by running the JSim model applet and clicking on the Source tab at the bottom left of JSim's Run Time graphical user interface. The equations are written in JSim's Mathematical Modeling Language (MML). See the Introduction to MML and the MML Reference Manual. Additional documentation for MML can be found by using the search option at the Physiome home page.
- Download JSim model MML code (text):
- Download translated SBML version of model (if available):
- No SBML translation currently available.
- Information on SBML conversion in JSim
We welcome comments and feedback for this model. Please use the button below to send comments:
 Yipintsoi T, Scanlon PD, and Bassingthwaighte JB. Density and water content of dog ventricular
        myocardium. Proc Soc Exp Biol Med 141: 1032-1035, 1972.

 Bassingthwaighte JB, Yipintsoi T, and Harvey RB. Microvasculature of the dog left ventricular
        myocardium. Microvasc Res 7: 229-249, 1974.

 Gonzalez F and Bassingthwaighte JB. Heterogeneities in regional volumes of distribution and
        flows in the rabbit heart. Am J Physiol Heart Circ Physiol 258: H1012-H1024, 1990.

 Vinnakota K and Bassingthwaighte JB. Myocardial density and composition:  A basis for
        calculating  intracellular metabolite concentrations.
        Am J Physiol Heart Circ Physiol 286: H1742-H1749, 2004.

 Bassingthwaighte JB and Vinnakota KC. The computational integrated myocyte.
        A view into the virtual heart. In: Modeling in Cardiovascular Systems.
        Ann. New York Acad. Sci. 1015:, edited by Sideman S. and Beyar R. 2004, pp 391-404.

 Brozek J, Grande F, Anderston JT, and Keys A. Densitometric analysis of body composition: revision of
        some quantitative assumptions. Ann NY Acad Sci 110: 113–140, 1963.

 Effros RM and Chinard FP. The in vivo pH of the extravascular space
        of the lung. J Clin Invest 48: 1983–1996, 1969. (for water content of RBC)

 Haurowitz, F. Chemistry and Biology of Proteins. New York: Academic Press; 1950. (for rho protein)

 Allen TH, Krzywicki HJ, Roberts JE. J. Appl. Physiol 1959;14:1005. [PubMed: 13792786]

 Allen TH, Welch BE, Trujillo TT, Roberts JE. J. Appl. Physiol 1959;14:1009. [PubMed: 13792787]
Please cite https://www.imagwiki.nibib.nih.gov/physiome in any publication for which this software is used and send one reprint to the address given below:
The National Simulation Resource, Director J. B. Bassingthwaighte, Department of Bioengineering, University of Washington, Seattle WA 98195-5061.
Model development and archiving support at https://www.imagwiki.nibib.nih.gov/physiome provided by the following grants: NIH U01HL122199 Analyzing the Cardiac Power Grid, 09/15/2015 - 05/31/2020, NIH/NIBIB BE08407 Software Integration, JSim and SBW 6/1/09-5/31/13; NIH/NHLBI T15 HL88516-01 Modeling for Heart, Lung and Blood: From Cell to Organ, 4/1/07-3/31/11; NSF BES-0506477 Adaptive Multi-Scale Model Simulation, 8/15/05-7/31/08; NIH/NHLBI R01 HL073598 Core 3: 3D Imaging and Computer Modeling of the Respiratory Tract, 9/1/04-8/31/09; as well as prior support from NIH/NCRR P41 RR01243 Simulation Resource in Circulatory Mass Transport and Exchange, 12/1/1980-11/30/01 and NIH/NIBIB R01 EB001973 JSim: A Simulation Analysis Platform, 3/1/02-2/28/07.