
Multipath Capillary-tissue exchange unit accounting for intra-organ flow heterogeneity.
Description
   This single path model for blood-tissue exchange serves as a multipath
 model representing an organ with heterogeneous regional flows. By setting
 the flow to a low value, as a low as the lowest expected in any region, the
 model outflow concentration-time curve C(L,t) represents only that at the end,
 L, of this slowest pathway. However by tapping a sequence of positions along
 the vessel to get the concentration-time curves, C(ai*L,t), where 0 < ai < L,
 one obtains a family of curves representing regions with higher than the
 lowest flow. The weighted array of the SUM of the Wi*C(ai*L,t) can be fitted
 to the experimentally observed outflow curve, Cdata(t), for the whole organ by
 optimization of the set of wi's. The result provides an estimate of the mean
 flow for the organ, Fbar, and the Wi/ai define the probability density
 function of regional flows, whose variance describes the heterogeneity of
 intraorgan flows per gram of tissue.

 This strategy  assumes linear, concentration independent transport across
 the capillary wall. It is exactly correct for tracer studies, but for
 chemical level studies where transporter or enzymes may be saturated, it
 is still a good approximation.
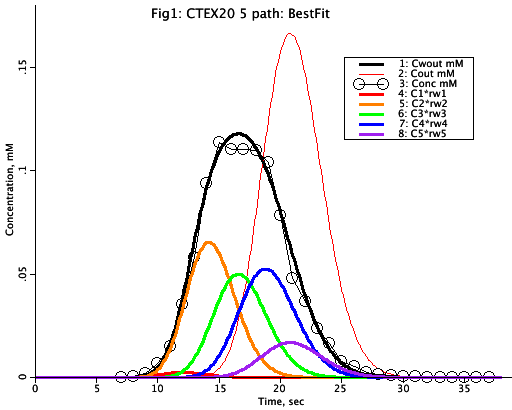
Figure: Plots concentration versus time for various points within the CTEX path. The points marked by the black 'circles' are a simulated data set which we are trying to match with the model. The thick colored lines represent concentration plots at various points ('taps') along the capillary. The 'thin' red line marked Cout is at the end of the capillary of length L. The others (C1-C5) are weighted outputs of which the sum of the 5 'paths' is the black solid line (Cwout). Change some of the weights, wi, and then reoptimize the wi's so that Cwout matches the data set (circles). Try this curve fitting technique a few times using different positioning of the taps L1 -L5. The estimate of mean flow Fbar should be almost independent of the choices of Li's and of the wi's if the fit is reasonably good.
Equations
The equations for this model may be viewed by running the JSim model applet and clicking on the Source tab at the bottom left of JSim's Run Time graphical user interface. The equations are written in JSim's Mathematical Modeling Language (MML). See the Introduction to MML and the MML Reference Manual. Additional documentation for MML can be found by using the search option at the Physiome home page.
- Download JSim model MML code (text):
- Download translated SBML version of model (if available):
- No SBML translation currently available.
- Information on SBML conversion in JSim
We welcome comments and feedback for this model. Please use the button below to send comments:
None.
Please cite https://www.imagwiki.nibib.nih.gov/physiome in any publication for which this software is used and send one reprint to the address given below:
The National Simulation Resource, Director J. B. Bassingthwaighte, Department of Bioengineering, University of Washington, Seattle WA 98195-5061.
Model development and archiving support at https://www.imagwiki.nibib.nih.gov/physiome provided by the following grants: NIH U01HL122199 Analyzing the Cardiac Power Grid, 09/15/2015 - 05/31/2020, NIH/NIBIB BE08407 Software Integration, JSim and SBW 6/1/09-5/31/13; NIH/NHLBI T15 HL88516-01 Modeling for Heart, Lung and Blood: From Cell to Organ, 4/1/07-3/31/11; NSF BES-0506477 Adaptive Multi-Scale Model Simulation, 8/15/05-7/31/08; NIH/NHLBI R01 HL073598 Core 3: 3D Imaging and Computer Modeling of the Respiratory Tract, 9/1/04-8/31/09; as well as prior support from NIH/NCRR P41 RR01243 Simulation Resource in Circulatory Mass Transport and Exchange, 12/1/1980-11/30/01 and NIH/NIBIB R01 EB001973 JSim: A Simulation Analysis Platform, 3/1/02-2/28/07.